
What it is
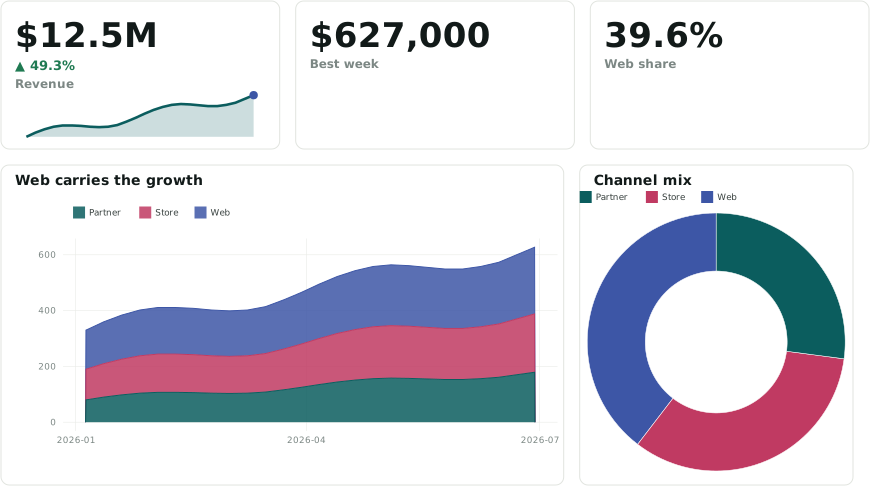
anofox-visualization turns DuckDB SQL into charts and dashboards. You write ordinary queries and tag output columns with ::ROLE casts; each annotated SELECT becomes a panel, rendered to SVG by ggplot-rs, a grammar-of-graphics engine written in Rust.
The annotation model
Section titled “The annotation model”- A chart is a measure tagged with a chart kind (
::BARCHART,::LINECHART,::SCATTER,::MAP, …) plus encodings:::XAXIS,::CATEGORY,::SIZE,::FACET. - A KPI is a value tagged
::METRIC,::MONEY,::PERCENT, with::DELTA,::SPARKLINEor::GOALbeside it. - A table is a
SELECT … ::TABLE(or::PAGED), with per-column formats and colour scales. - An input (
::DROPDOWN,::PERIOD,::DATERANGE, …) sets a variable that other panels read withgetvariable('name')— that is how filters, cross-filters and drill-downs work. - Layout is roles too:
::TAB,::GROUP,::COL,::HEIGHT. - Statements without roles (
CREATE TABLE,SET VARIABLE) are setup.
The annotation model lists all 241 roles; dashboard --roles prints them, dashboard --check flags unknown ones.
Two builds
Section titled “Two builds”| Community extension | Full toolkit | |
|---|---|---|
| Get it | INSTALL anofox_visualization FROM community |
a GitHub release |
| Gives you | anofox_render and the chart macros (SQL → SVG) |
rendering plus the servers (anofox_serve, anofox_serve_dashboards), the embedded builder, the dashboard / serve CLIs |
| For | charts inside queries, notebooks, reports | dashboards, sites, servers, CI checks |
Where it runs
Section titled “Where it runs”In the browser (DuckDB-Wasm), in any DuckDB, from the CLI, as a static website, or on a locked server — see Which way to run it.