
::HISTOGRAM
Dashboards: browser · CLI · servers
Community extension: anofox_render
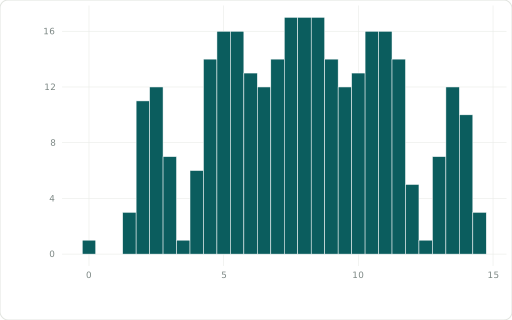
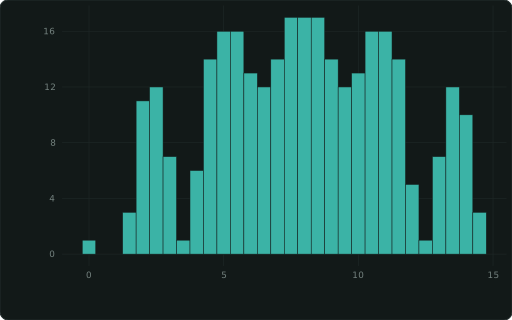
Histogram of the measure; takes ::FLIP (horizontal, with ::FACET panels too), ::YFORMAT / ::YSCALE on its count axis, ::DATALABELS (each bin’s count, or share under ::HIST_NORM), ::ABLINE, ::XLINE.
Also spelled: ::HIST
The data it needs
Section titled “The data it needs”Raw rows: one per observation, the measure only. The bins are computed for you.
SELECT (i * 7919) % 100 / 10.0 + (i % 7) ::HISTOGRAM FROM range(0, 300) r(i);In an example
Section titled “In an example”From Can we build a dashboard without a data source? — open it in the builder ↗:
SELECT ((i*7) % 34 + (i*13) % 33 + (i*29) % 31)::HISTOGRAM, 'Value distribution'::TITLE FROM range(0, 500) t(i)Also in: Which chart fits which question? · Which forecast method fits our demand? · Where do our deliveries and customers cluster, and which regions are underserved?
Related
Section titled “Related”::DENSITY · ::RIDGELINE · ::BOXPLOT · ::VIOLIN · ::QQ