
Tables
Every ::TABLE gets search, filters, totals, column stats, CSV and Excel export. Column roles format the cells; directives before the table add totals, groups, flags and selection.
The sample data every tile on this page uses
CREATE TABLE stores AS SELECT * FROM (VALUES ('North', 'Berlin', 1240000, 0.124, 4.1, 'on plan', [5, 7, 6, 9, 8, 11]), ('North', 'Hamburg', 980000, 0.098, -2.3, 'at risk', [6, 5, 5, 4, 5, 4]), ('South', 'Munich', 1410000, 0.141, 6.8, 'on plan', [4, 6, 7, 8, 9, 10]), ('South', 'Stuttgart', 760000, 0.076, -5.1, 'behind', [7, 6, 5, 4, 3, 3]), ('West', 'Cologne', 890000, 0.089, 1.2, 'on plan', [5, 5, 6, 6, 6, 7]), ('West', 'Düsseldorf', 640000, 0.064, -0.4, 'at risk', [4, 4, 5, 4, 4, 4])) t(region, store, revenue, margin, growth, status, weekly);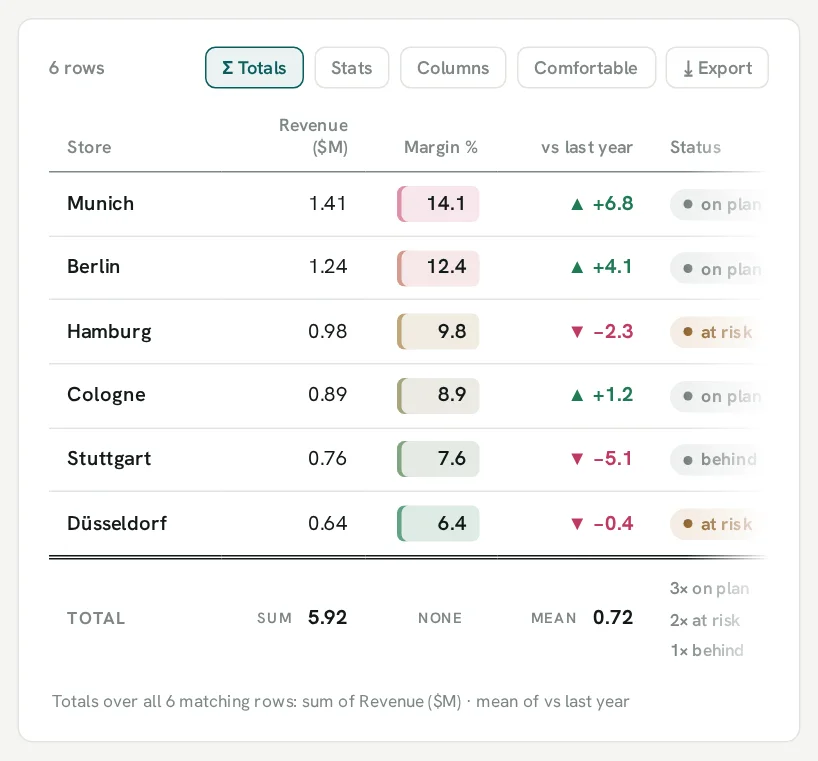
Formatted columns
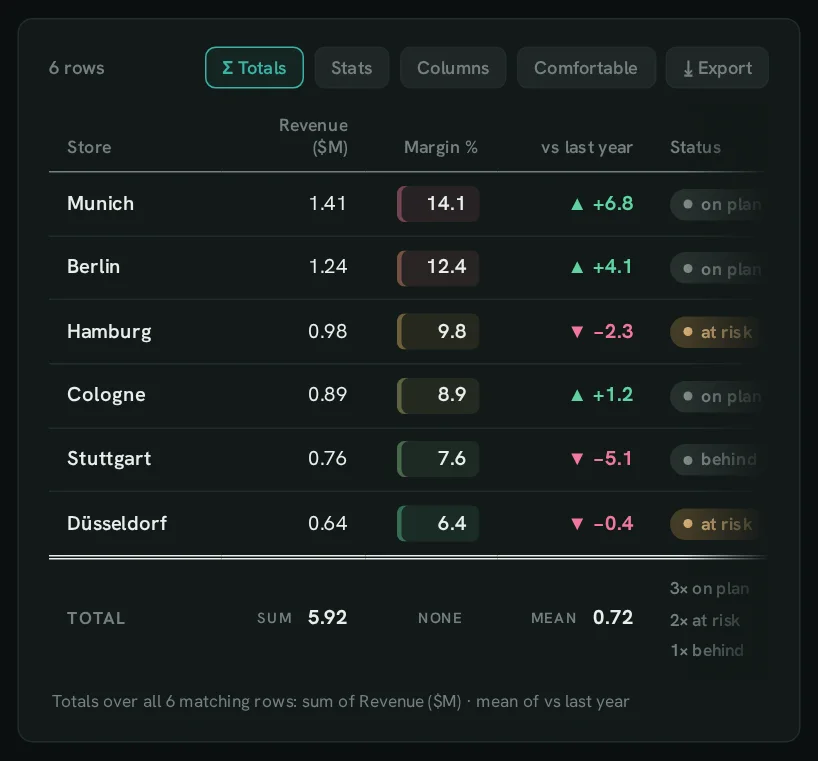
Section titled “Formatted columns”Money, a colour scale, a signed trend and status pills — one role per column.
SELECT store ::TABLE, revenue AS "Revenue" ::MONEY, round(100 * margin, 1) AS "Margin %" ::COLORSCALE, growth AS "vs last year" ::TREND, status AS "Status" ::BADGEFROM stores ORDER BY revenue DESC;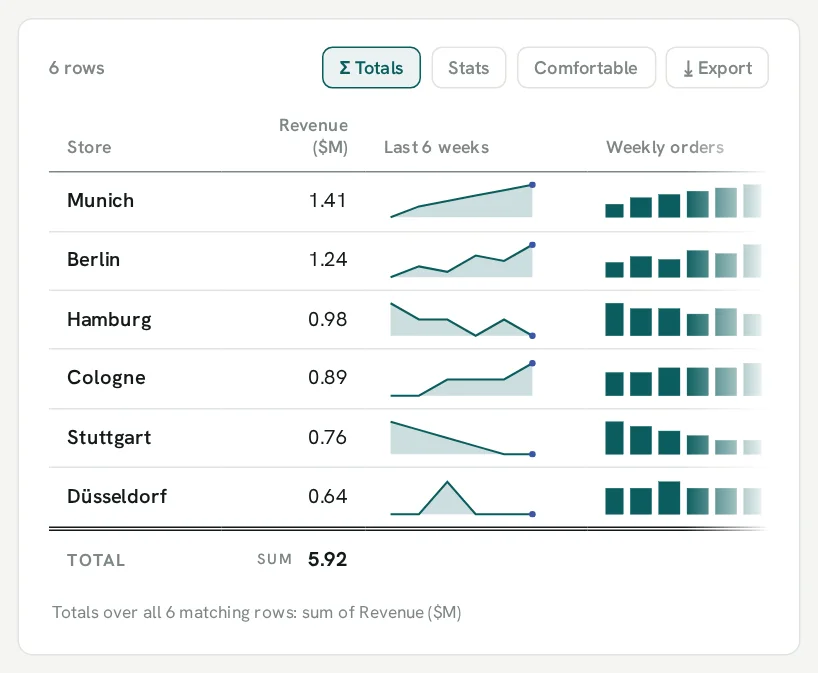
Sparklines in cells
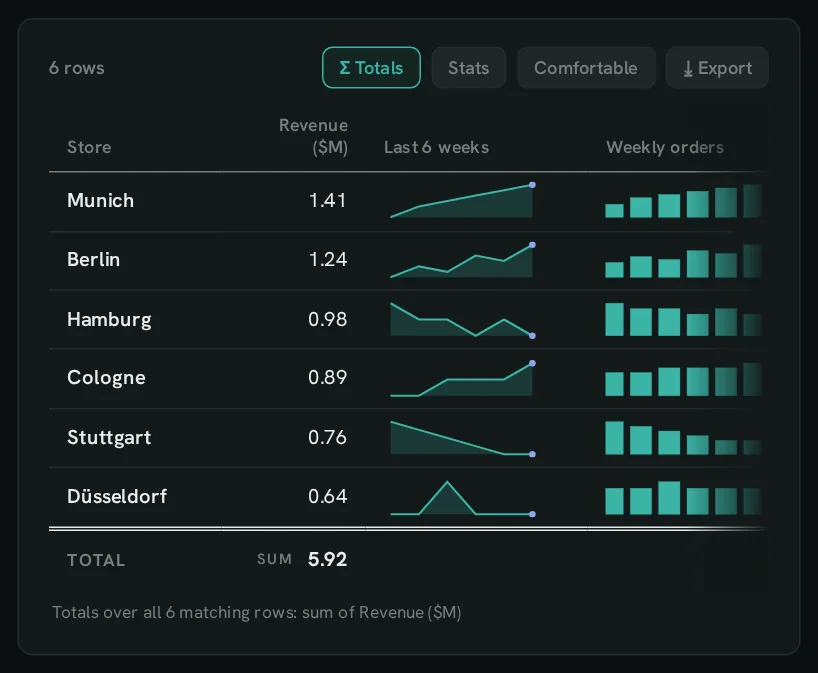
Section titled “Sparklines in cells”A list() column becomes a mini chart per row: ::SPARKLINE or ::SPARKBAR.
SELECT store ::TABLE, revenue AS "Revenue" ::MONEY, weekly AS "Last 6 weeks" ::SPARKLINE, weekly AS "Weekly orders" ::SPARKBARFROM stores ORDER BY revenue DESC;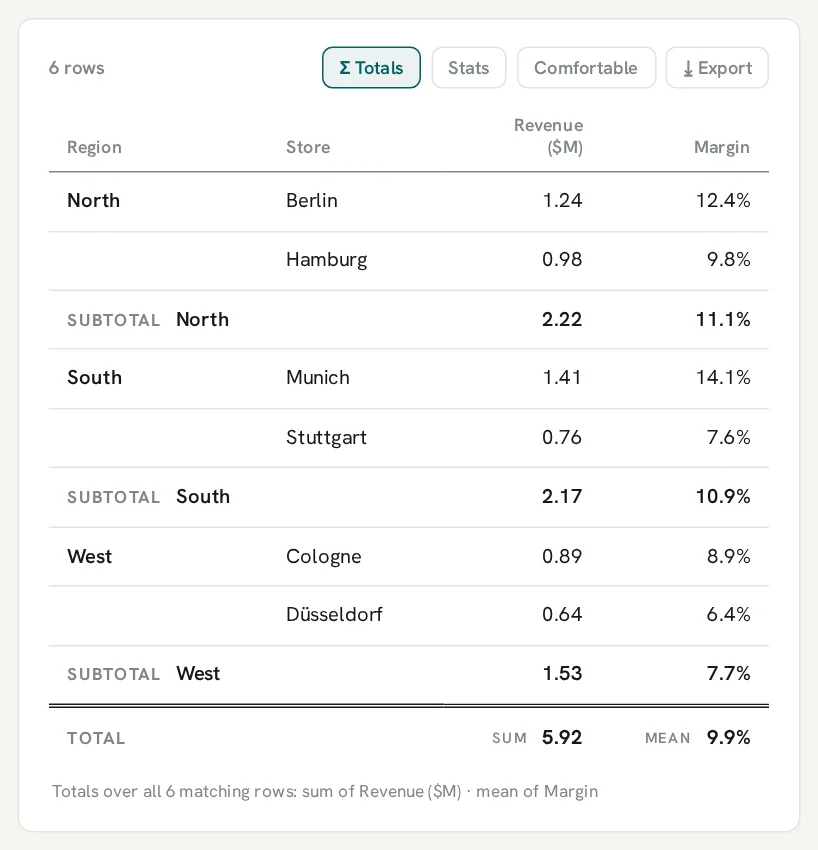
Subtotals and totals
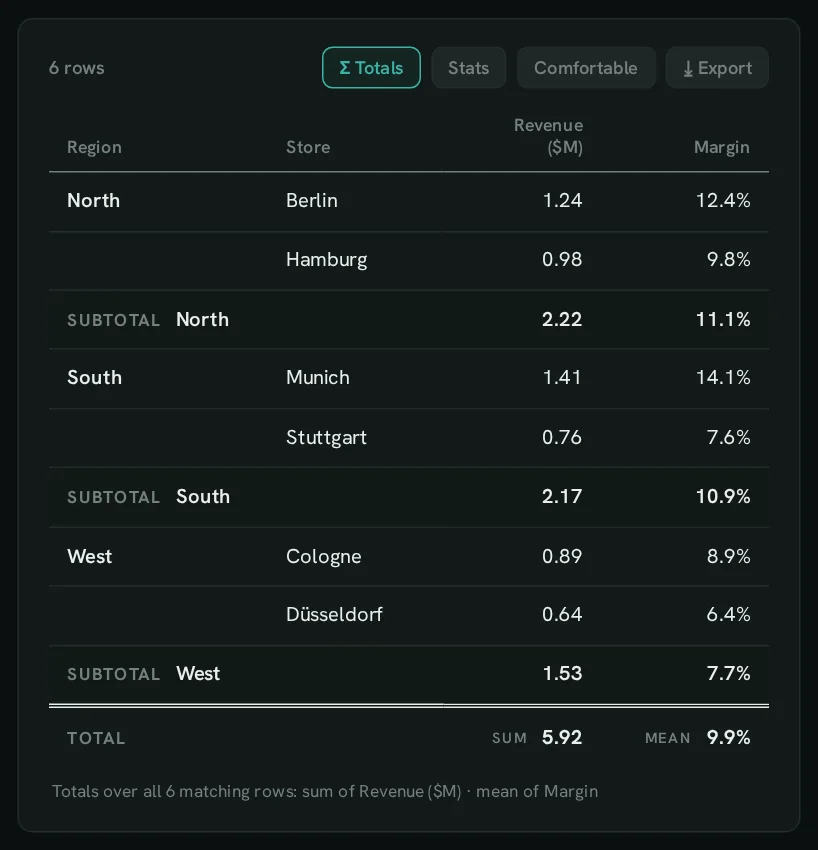
Section titled “Subtotals and totals”::SUBTOTAL adds a row per group, ::TOTALS sets the totals row — in the browser, Excel and the static page.
SELECT 'region'::SUBTOTAL;SELECT 'Revenue: sum; Margin: mean'::TOTALS;SELECT region ::TABLE, store, revenue AS "Revenue" ::MONEY, round(100 * margin, 1) AS "Margin" ::PERCENTFROM stores ORDER BY region, revenue DESC;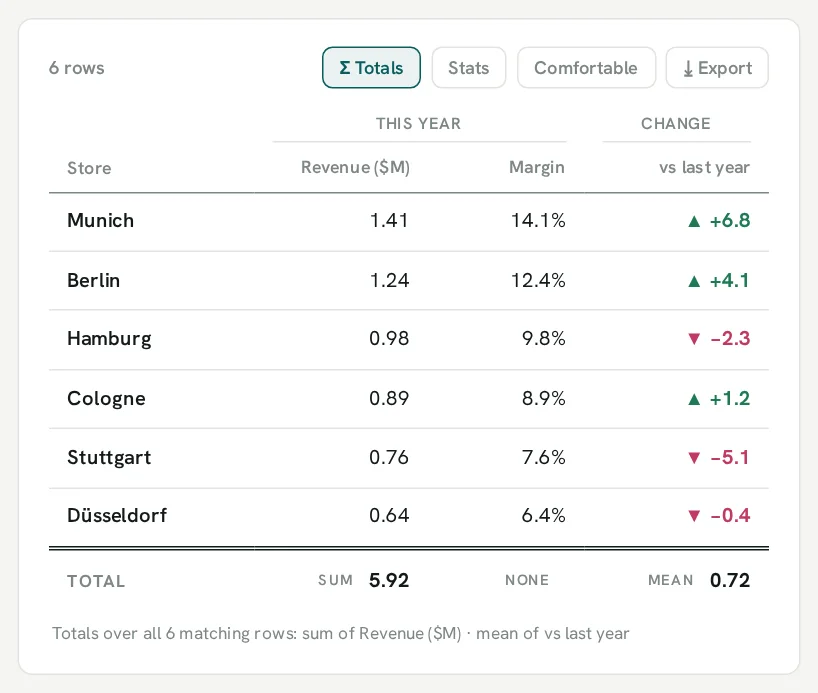
Grouped headers
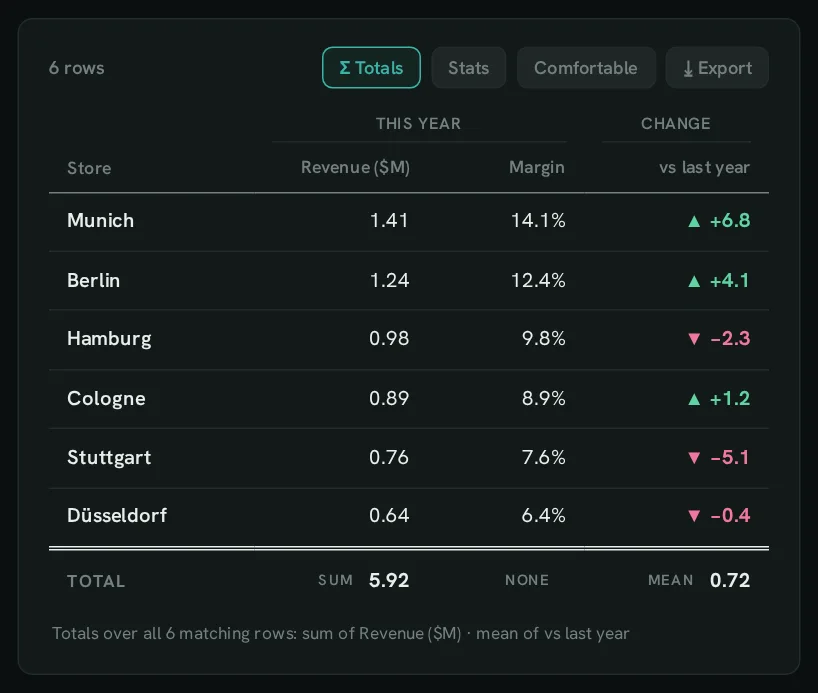
Section titled “Grouped headers”::COLGROUP puts a label over adjacent columns.
SELECT 'This year: Revenue, Margin | Change: vs last year'::COLGROUP;SELECT store ::TABLE, revenue AS "Revenue" ::MONEY, round(100 * margin, 1) AS "Margin" ::PERCENT, growth AS "vs last year" ::TRENDFROM stores ORDER BY revenue DESC;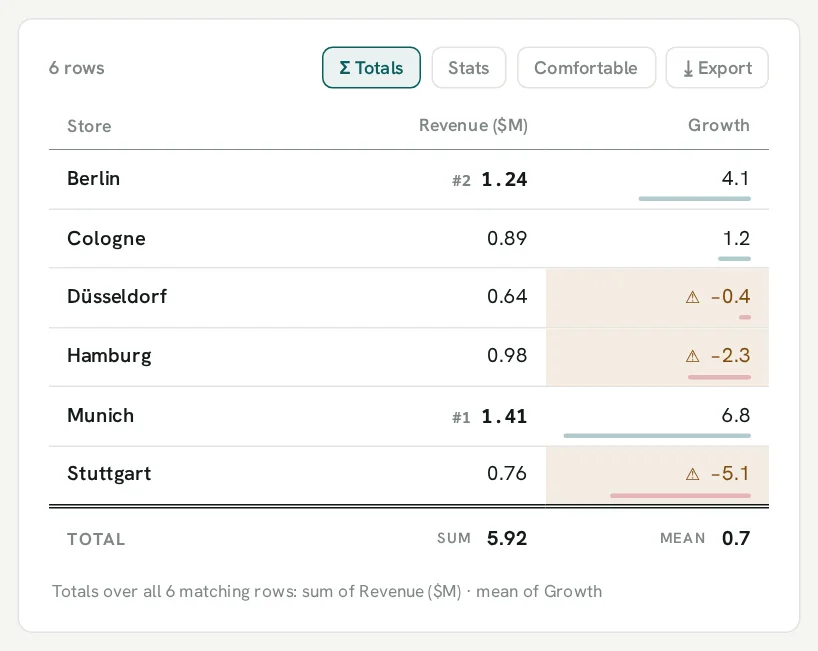
Flags and top-n
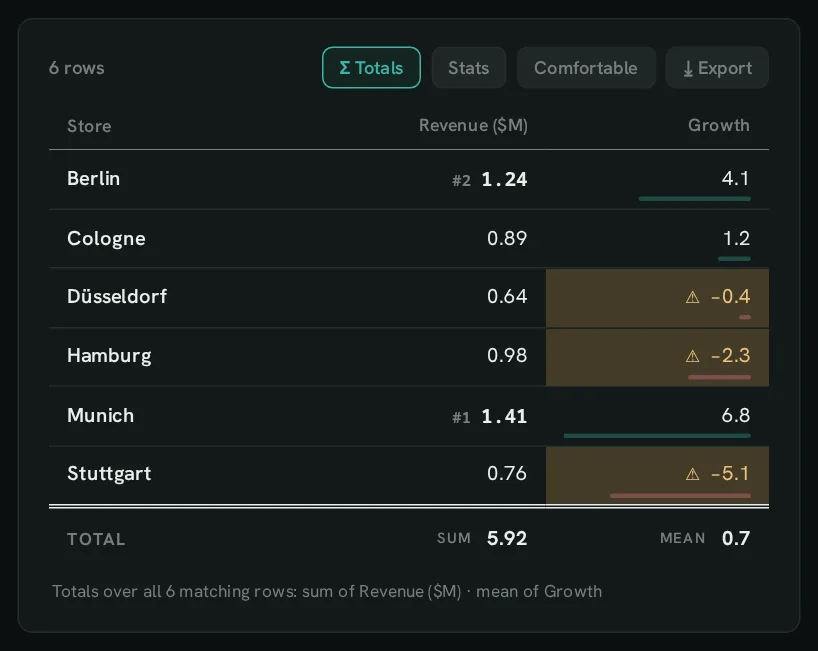
Section titled “Flags and top-n”::FLAG marks cells that meet a condition, ::HIGHLIGHT ranks the top and bottom values.
SELECT 'Growth < 0'::FLAG;SELECT 'Revenue: top 2'::HIGHLIGHT;SELECT store ::TABLE, revenue AS "Revenue" ::MONEY, growth AS "Growth" FROM stores ORDER BY store;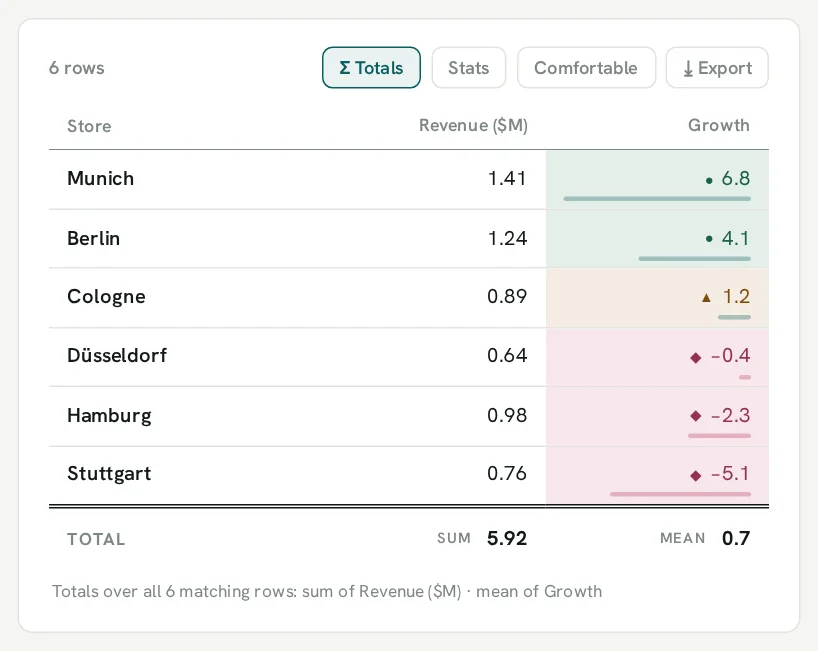
Status rules
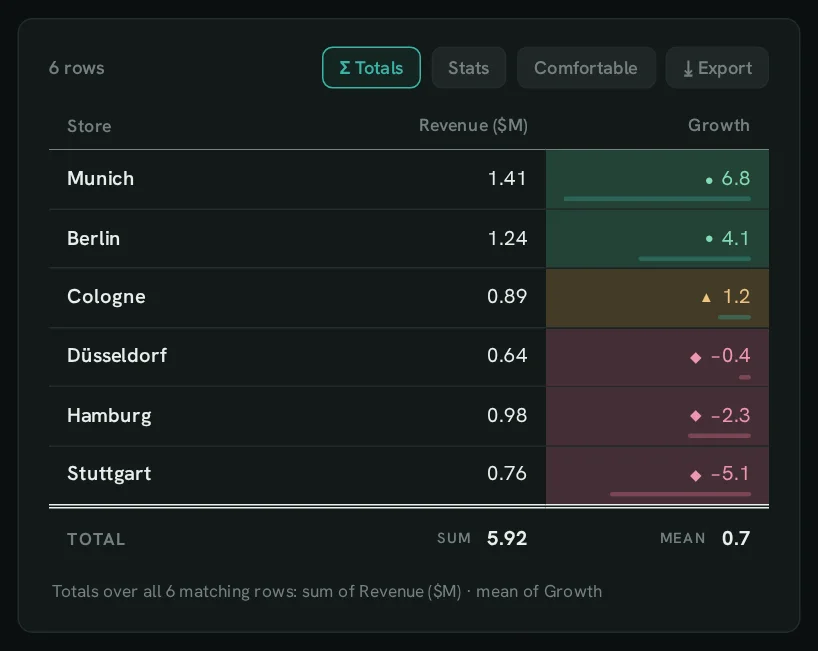
Section titled “Status rules”::THRESHOLDS alone colours the next table’s cells by rules per column.
SELECT 'Growth: <0:bad; <3:warn; good'::THRESHOLDS;SELECT store ::TABLE, revenue AS "Revenue" ::MONEY, growth AS "Growth" FROM stores ORDER BY growth DESC;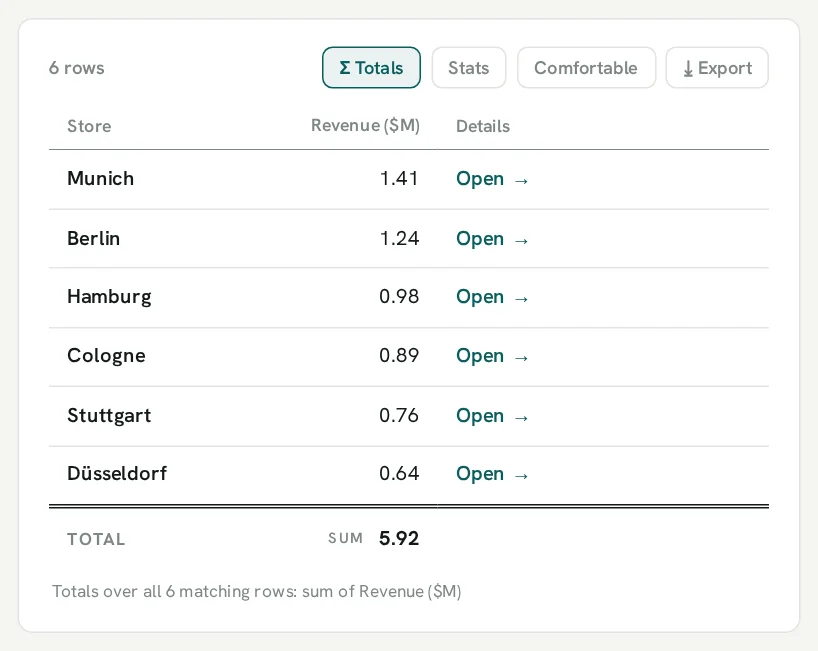
Selectable rows and links
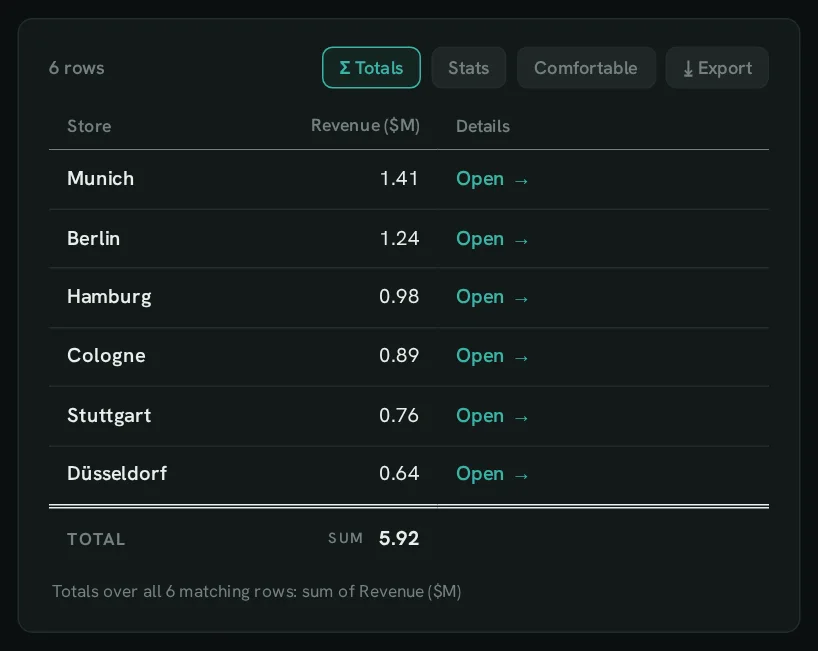
Section titled “Selectable rows and links”::ROWSELECT makes a click set a variable; a ::LINK column opens another tab, dashboard or URL.
SELECT 'single'::ROWSELECT;SELECT store ::TABLE, revenue AS "Revenue" ::MONEY, '?v.store=' || store AS "Details" ::LINK FROM stores ORDER BY revenue DESC;