
::MAP
Dashboards: browser · CLI · servers
Community extension: anofox_render
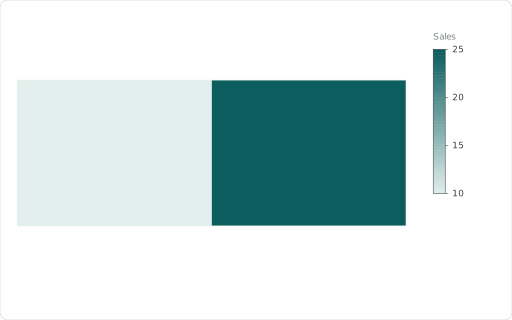
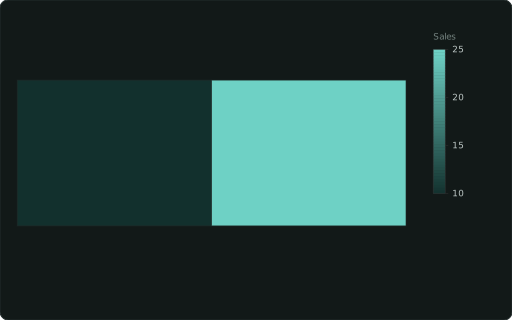
WKT-geometry map, coloured by a measure.
Also spelled: ::GEOMETRY, ::GEO, ::CHOROPLETH
The data it needs
Section titled “The data it needs”One row per feature: its geometry as WKT text (ST_AsText(geom)), a measure to colour it (any chart cast on a numeric column), ::LABEL to name it.
SELECT wkt ::MAP, name ::LABEL, v AS "Sales" ::BARCHARTFROM (VALUES ('POLYGON((0 0, 4 0, 4 3, 0 3, 0 0))','West',10),('POLYGON((4 0, 8 0, 8 3, 4 3, 4 0))','East',25)) t(wkt, name, v);In an example
Section titled “In an example”From Which van serves which stop tomorrow? — open it in the builder ↗:
SELECT wkt ::MAP, series ::CATEGORY, label ::LABEL, base ::BASEMAP, 'routes'::SYNC_ZOOM, 'Depot:neutral; Late stop:bad'::COLORS, ('Today''s plan: ' || round(t_km)::INTEGER || ' km, ' || CASE WHEN t_late = 0 THEN 'all 40 stops on time' ELSE t_late || ' of 40 stops late' END)::TITLEFROM dr_map(dr_today()), dr_cmp()ORDER BY layer, van, label, base