
::PIE
Dashboards: browser · CLI · servers
Community extension: anofox_render
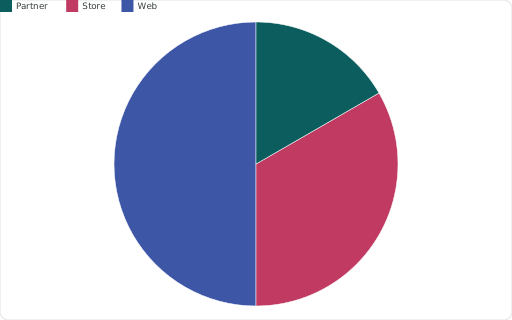
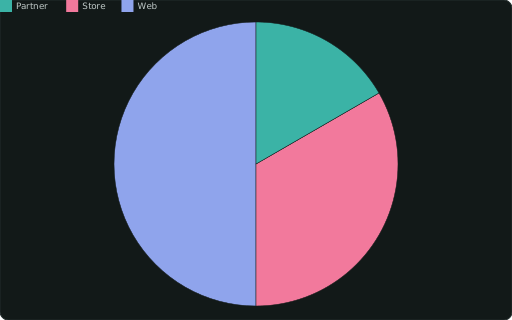
Pie — slices by CATEGORY, sized by the measure.
Also spelled: ::PIECHART, ::PIECHART_PERCENT
The data it needs
Section titled “The data it needs”One row per slice: ::CATEGORY names it, the measure sizes it. Keep it to a handful of slices.
SELECT channel ::CATEGORY, revenue ::PIE FROM (VALUES ('Web',120),('Store',80),('Partner',40)) t(channel, revenue);In an example
Section titled “In an example”From Where do our sessions come from? — open it in the builder ↗:
SELECT '**How it works:** every panel is a SQL query whose columns are tagged with `::ROLE` casts — `::XAXIS`, `::CATEGORY`, a chart kind like `::BARCHART_STACKED`, `::PIE`, `::LINECHART`, `::TABLE`, or a KPI (`::COMPACT`/`::METRIC`). Un-annotated statements (the `CREATE TABLE`) are setup. **Click a pie slice or a table row** — the KPI strip filters via `getvariable(''selected'')`.'::MARKDOWN, 'What this shows'::TITLEAlso in: Which chart fits which question? · How is revenue split by week and channel?
Related
Section titled “Related”::DONUTCHART · ::GAUGE · ::RADAR · ::SANKEY · ::TREEMAP