
::CALENDAR
Dashboards: browser · CLI · servers
Community extension: anofox_render
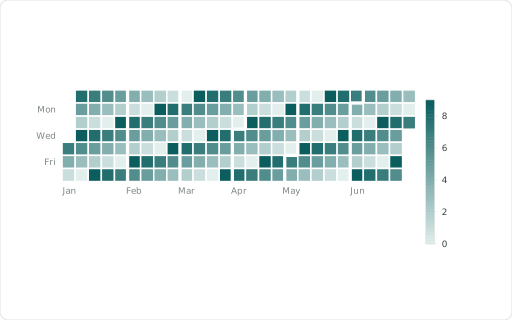
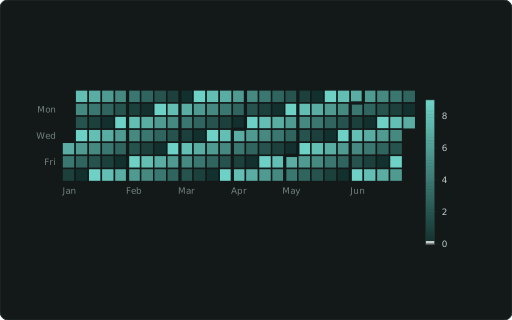
Calendar heatmap (date XAXIS, ≤ 50 years).
Also spelled: ::CALENDAR_HEATMAP, ::CAL_HEATMAP
The data it needs
Section titled “The data it needs”One row per day: a date ::XAXIS, the measure is the day’s colour.
SELECT d::DATE ::XAXIS, (dayofyear(d) * 37) % 10 ::CALENDARFROM range(DATE '2026-01-01', DATE '2026-07-01', INTERVAL 1 DAY) r(d);In an example
Section titled “In an example”From Which chart fits which question? — open it in the builder ↗:
SELECT 12::COL; SELECT d::XAXIS, value::CALENDAR, 'Calendar heatmap — a year of daily activity'::TITLE FROM cal ORDER BY dAlso in: How is our German branch doing this year?