
::AREACHART
Dashboards: browser · CLI · servers
Community extension: anofox_render
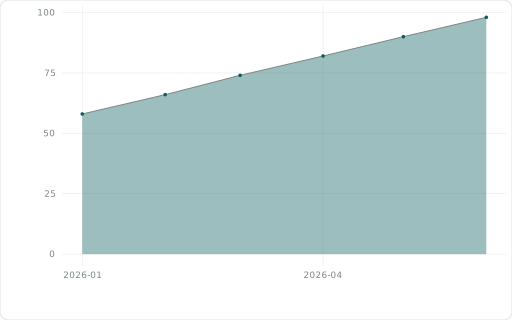
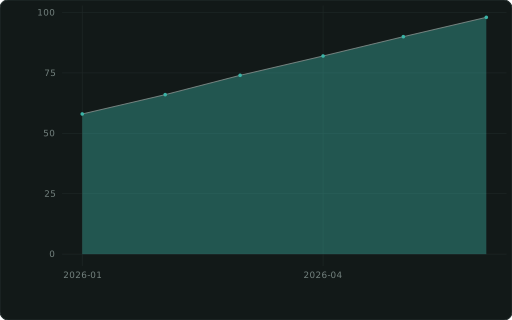
Area chart.
Also spelled: ::AREA
The data it needs
Section titled “The data it needs”As ::LINECHART, filled down to zero.
SELECT m ::XAXIS, 50 + 8 * month(m) ::AREACHART FROM range(DATE '2026-01-01', DATE '2026-07-01', INTERVAL 1 MONTH) r(m);In an example
Section titled “In an example”From Which region, country and city bring the revenue? — open it in the builder ↗:
SELECT week::XAXIS, sum(revenue)::AREACHART, ('Weekly revenue — ' || coalesce(nullif(getvariable('country'), ''), nullif(getvariable('region'), ''), 'all regions'))::TITLEFROM ordersWHERE getvariable('region') IN ('', region) AND getvariable('country') IN ('', country)GROUP BY week ORDER BY weekAlso in: Which materials will run short next quarter?
Related
Section titled “Related”::LINECHART · ::LINECHART_PERCENT · ::STEP · ::SMOOTH · ::AREACHART_STACKED · ::CANDLESTICK · ::SPARKLINE · ::SPARKBAR