
Models and forecasts
One call per result
Section titled “One call per result”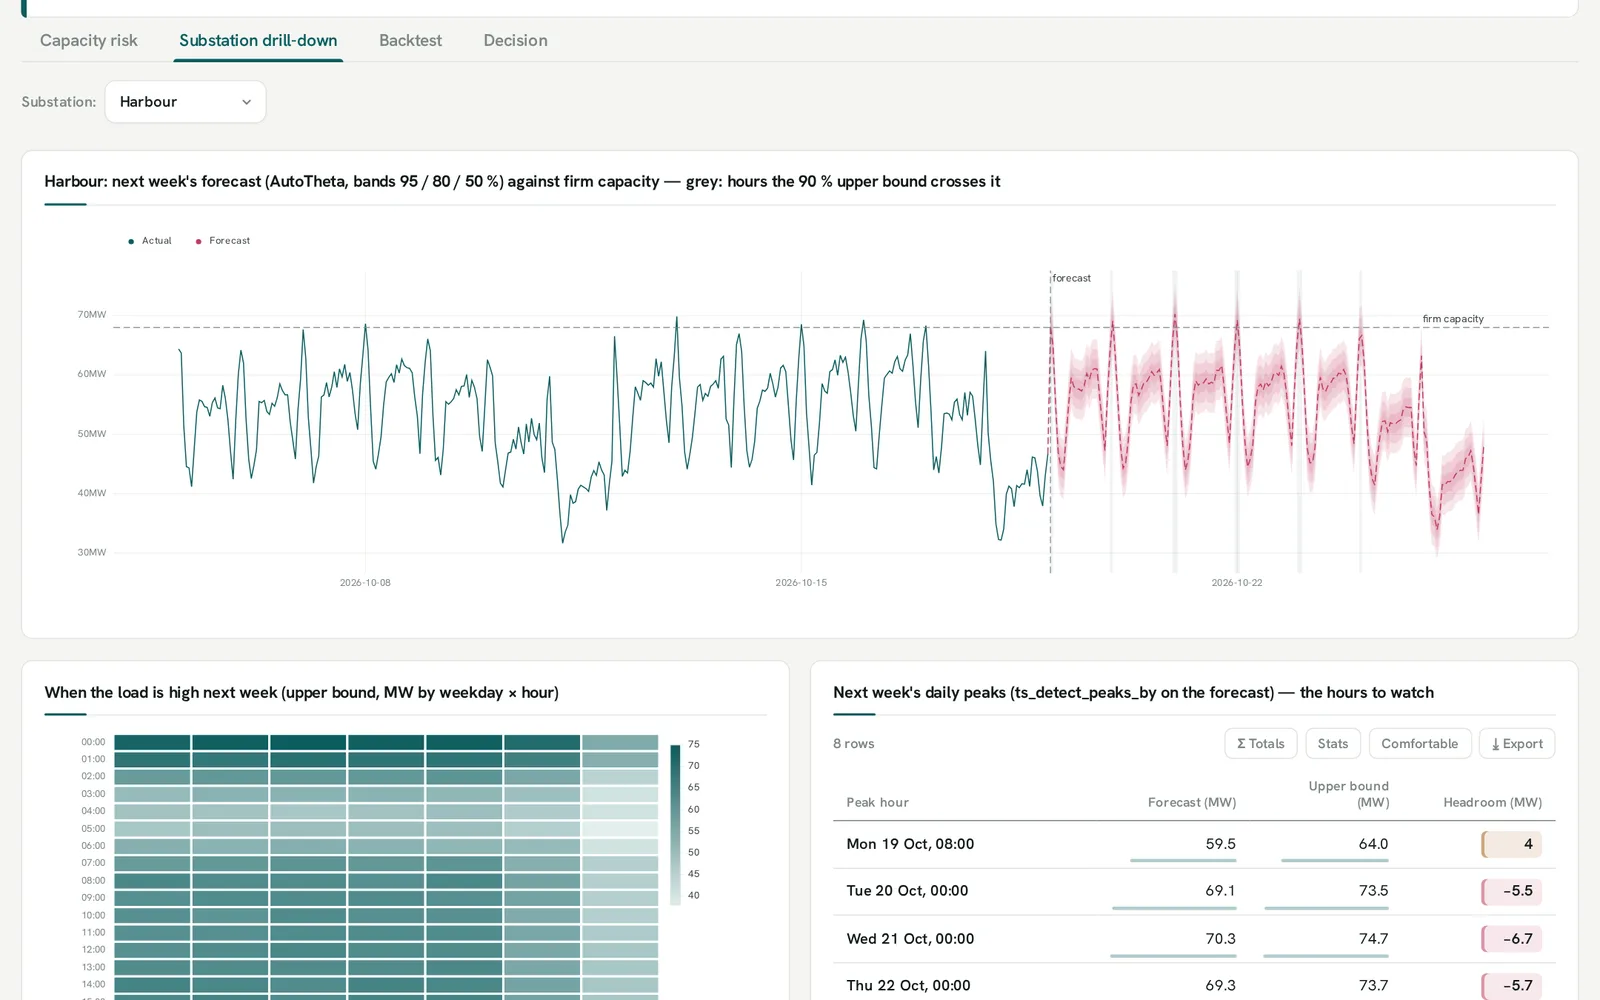
The anofox extensions return their results as tables in a shared integration contract. anofox_plot(t) picks the plot from the table’s columns. The anofox_plot_* macros choose it explicitly:
LOAD anofox_statistics; LOAD anofox_visualization;SELECT anofox_plot_terms(c) FROM ols_tidy_by('sales', region, revenue, [price, promo]) c; -- a coefficient forestSELECT id, anofox_plot_prediction(f) FROM ts_forecast_by('sales', id, ds, y, 'AutoETS', 14, '1d') f GROUP BY id;| Macro | Draws |
|---|---|
anofox_plot_terms |
coefficients with intervals (forest), λ paths, quantile processes |
anofox_plot_prediction |
observed points, the fit or forecast with nested interval bands, hold-out splits |
anofox_plot_curve |
ROC, PR, calibration, Kaplan–Meier, ACF/PACF, λ cross-validation |
anofox_plot_summary |
one small panel per metric, models compared |
anofox_plot_tests |
a forest of test results, coloured by significance |
anofox_plot_compare |
box / violin per group with significance brackets |
anofox_plot_obs, anofox_plot_diagnostics |
residual diagnostics, the plot.lm 2×2 |
anofox_plot_decomposition |
trend, seasonal and remainder panels |
anofox_plot_checks, anofox_plot_events, anofox_plot_schedule |
data-quality checks, event timelines, schedules (Gantt) |
They are aggregates: GROUP BY gives one SVG per group, and they work in the community extension too. Macro reference → · The extensions, one by one →
The same pictures as panels
Section titled “The same pictures as panels”Inside a dashboard, the roles draw the pieces directly:
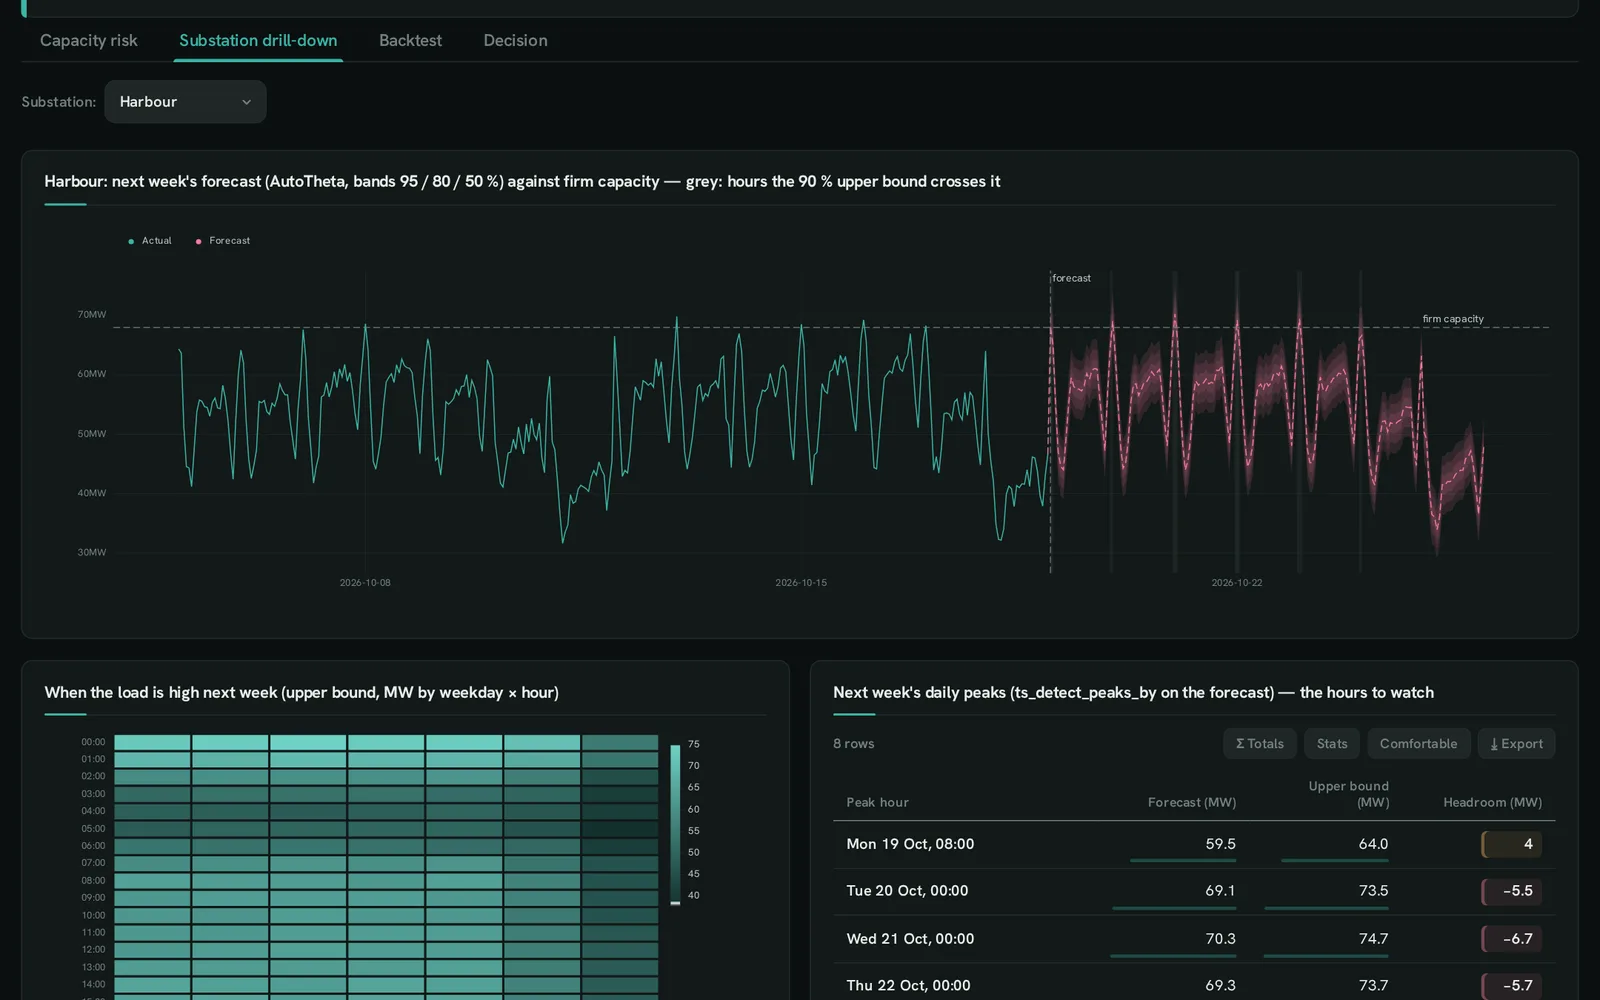
SELECT ds ::XAXIS, y AS "Actual" ::SCATTER, yhat AS "Forecast" ::LINECHART, yhat_lower ::BAND_LOWER, yhat_upper ::BAND_UPPER, 'Demand, next 14 days'::TITLEFROM forecast ORDER BY ds;| Roles | For |
|---|---|
::BAND_LOWER / ::BAND_UPPER |
a shaded band around a line; several pairs make a nested fan |
::YMIN / ::YMAX, ::XMIN / ::XMAX |
error bars, point ranges |
::REFLINE, ::XLINE, ::ABLINE, ::IDENTITY |
reference lines: a target, an event, y = a·x + b, y = x |
::XBAND_FROM / ::XBAND_TO, ::MARKAREA |
shaded x ranges: a hold-out, an outage |
::ANNOTATE, ::LABEL_TOP |
callouts at a point; labels on the top-k points |
::FACET |
small multiples, one panel per value |
::Q1, ::MEDIAN, ::Q3, … |
box plots from statistics you already have |