
Your first dashboard
Open the builder, click New dashboard, and paste:
-- @title How are our channels doing?CREATE TABLE sales AS SELECT * FROM (VALUES  ('W1','app',30), ('W1','web',22), ('W2','app',35), ('W2','web',25), ('W3','app',41), ('W3','web',24)) t(week, channel, revenue);
SELECT channel AS channel ::DROPDOWN FROM sales GROUP BY 1 ORDER BY 1;
SELECT sum(revenue)::MONEY, 'Revenue'::LABEL FROM sales WHERE channel = getvariable('channel');
SELECT week::XAXIS, sum(revenue)::LINECHART, 'Revenue by week'::TITLEFROM sales WHERE channel = getvariable('channel') GROUP BY ALL ORDER BY week;
Run draws a dropdown, a KPI tile and a line chart; changing the dropdown filters both:
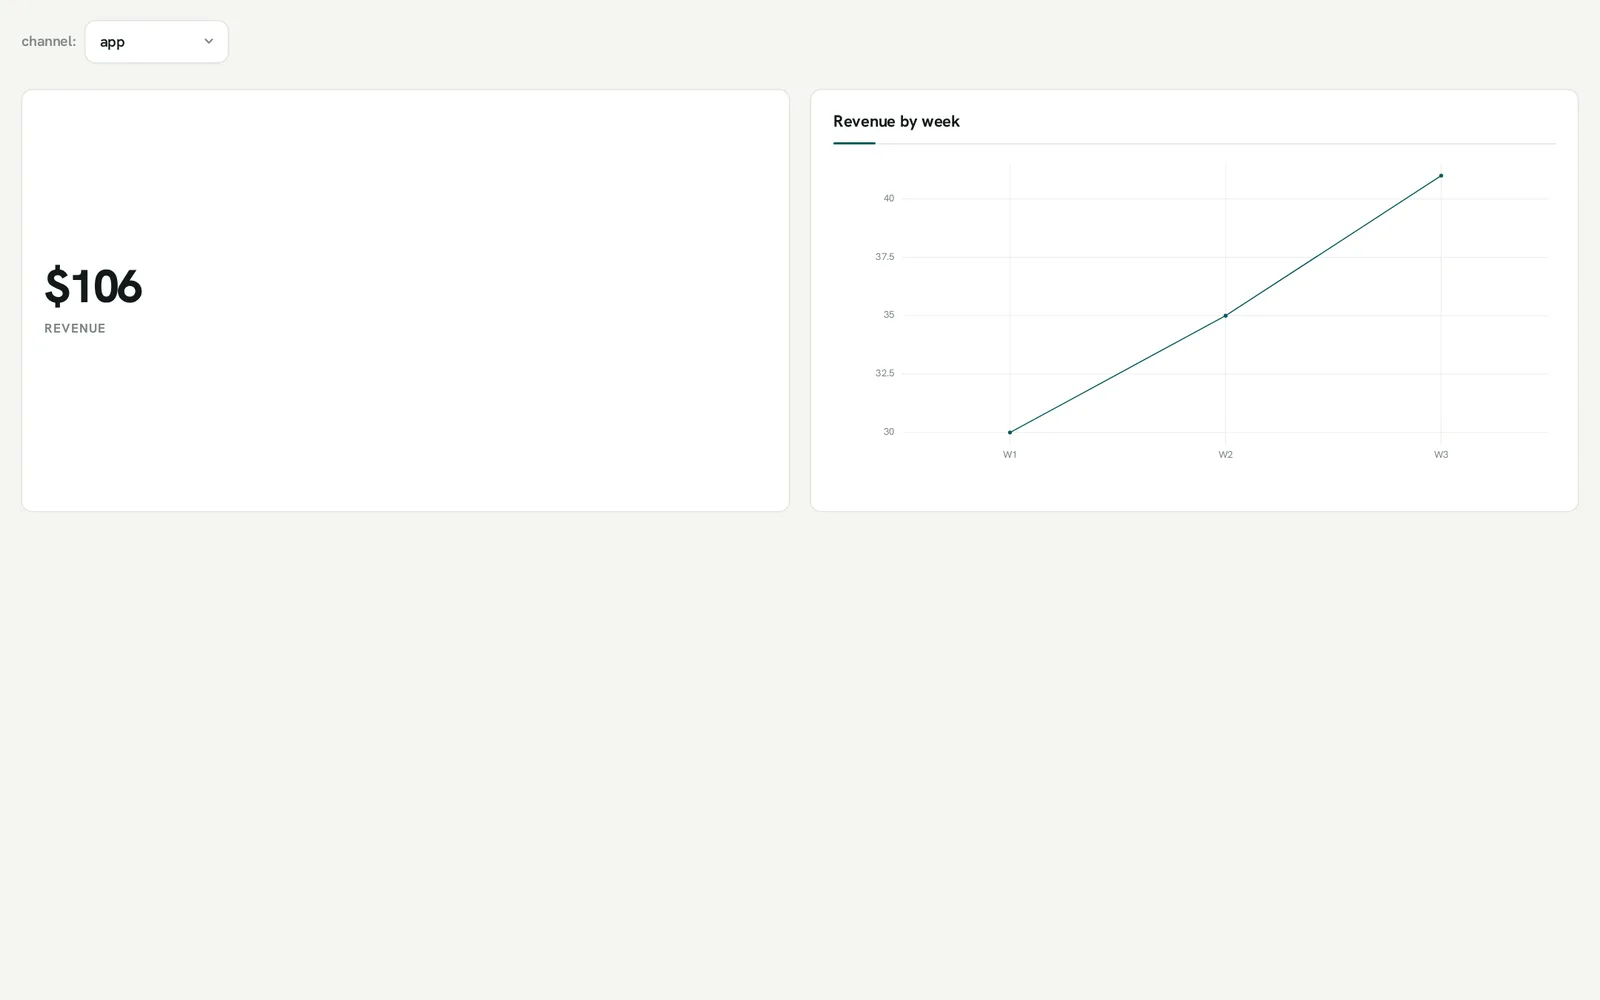
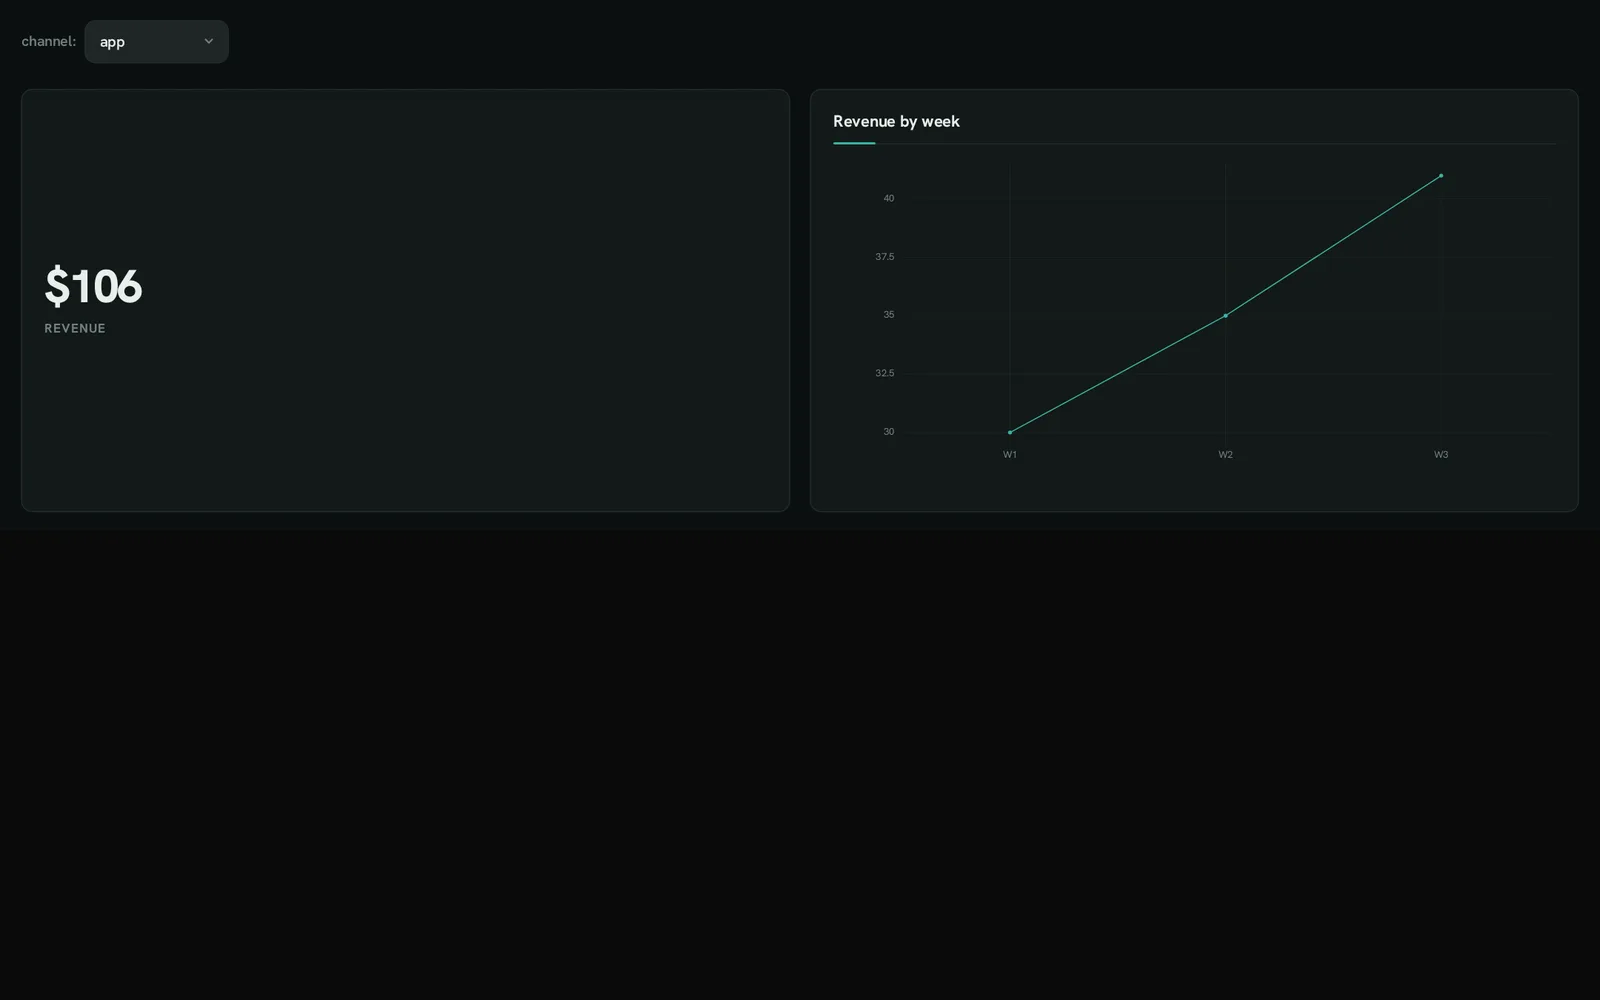
-- @titlenames the dashboard (a question it answers).- The dropdown’s column alias (
channel) is the variable; panels read it withgetvariable('channel'). - Save keeps it in this browser; Share copies a link with the SQL; ⤓ HTML downloads a standalone page.
Next: the role reference, the design principles, and dashboard --check before you share it. The Claude Code plugin writes dashboards from a plain-language request: /plugin marketplace add DataZooDE/anofox-visualization, then /plugin install anofox-visualization@anofox-visualization.