
Dashboards: browser · CLI · servers
Community extension: anofox_render
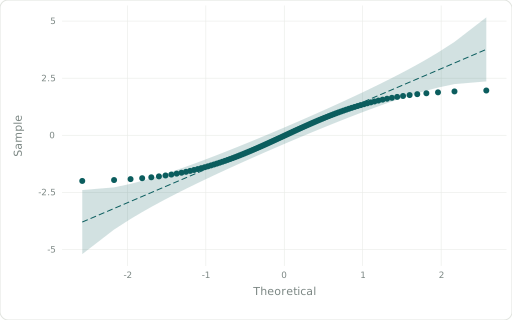
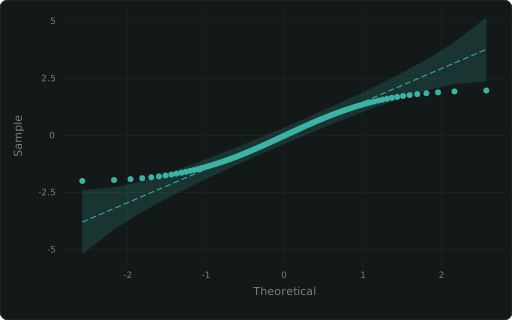
Normal quantile-quantile plot with a 95% pointwise band.
Also spelled: ::QQPLOT
The data it needs
Section titled “The data it needs”Raw rows: one per observation (residuals, say); plotted against normal quantiles with a 95 % band.
SELECT (i * 7919) % 100 / 25.0 - 2 ::QQ FROM range(0, 100) r(i);In an example
Section titled “In an example”From Which forecast method fits our demand? — open it in the builder ↗:
SELECT 6::COL; SELECT remainder ::QQ, 'Residual normal Q-Q'::TITLE FROM an_decomp WHERE category='FOODS'Related
Section titled “Related”::HISTOGRAM · ::DENSITY · ::RIDGELINE · ::BOXPLOT · ::VIOLIN