
::HEATMAP
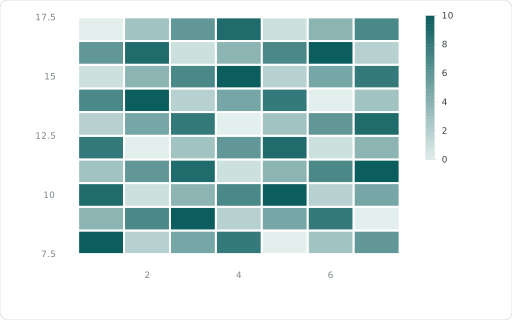
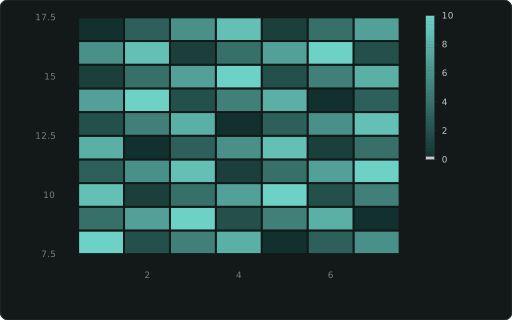
Tiles at XAXIS×YAXIS coloured by the measure (rows in SQL order; diverging around 0); a numeric measure sizes every tile alike regardless of how many x points each row has; a text measure (status words) takes ::COLORS as a level map for a categorical legend, like a ::CATEGORY column’s.
Also spelled: ::TILE, ::TILES
The data it needs
Section titled “The data it needs”One row per tile: ::XAXIS × ::YAXIS, the measure is its colour (a text measure with ::COLORS maps status words to colours).
SELECT d ::XAXIS, h ::YAXIS, (d * 3 + h * 5) % 11 ::HEATMAPFROM range(1, 8) a(d), range(8, 18) b(h);In an example
Section titled “In an example”From Can we build a dashboard without a data source? — open it in the builder ↗:
SELECT (i % 12)::XAXIS, floor(i/12.0)::YAXIS, round(avg(sin(i/6.0)*cos(floor(i/12.0)/3.0)*40 + 50),0)::HEATMAP, 'sin · cos surface'::TITLEFROM range(0, 96) t(i) GROUP BY 1,2 ORDER BY 1,2;Also in: Which chart fits which question? · When could we run out of stock? · Where will stock run short, and can we trust the plan? · What should we order this week to sell the most? · How reliable are our suppliers, and what does it cost us in stock? · How do we plan a busy day at the distribution centre?