
Layout and tabs
Panels flow left to right on a 12-column grid in the order of the script and wrap when a row is full. On a narrow screen every panel goes full width.
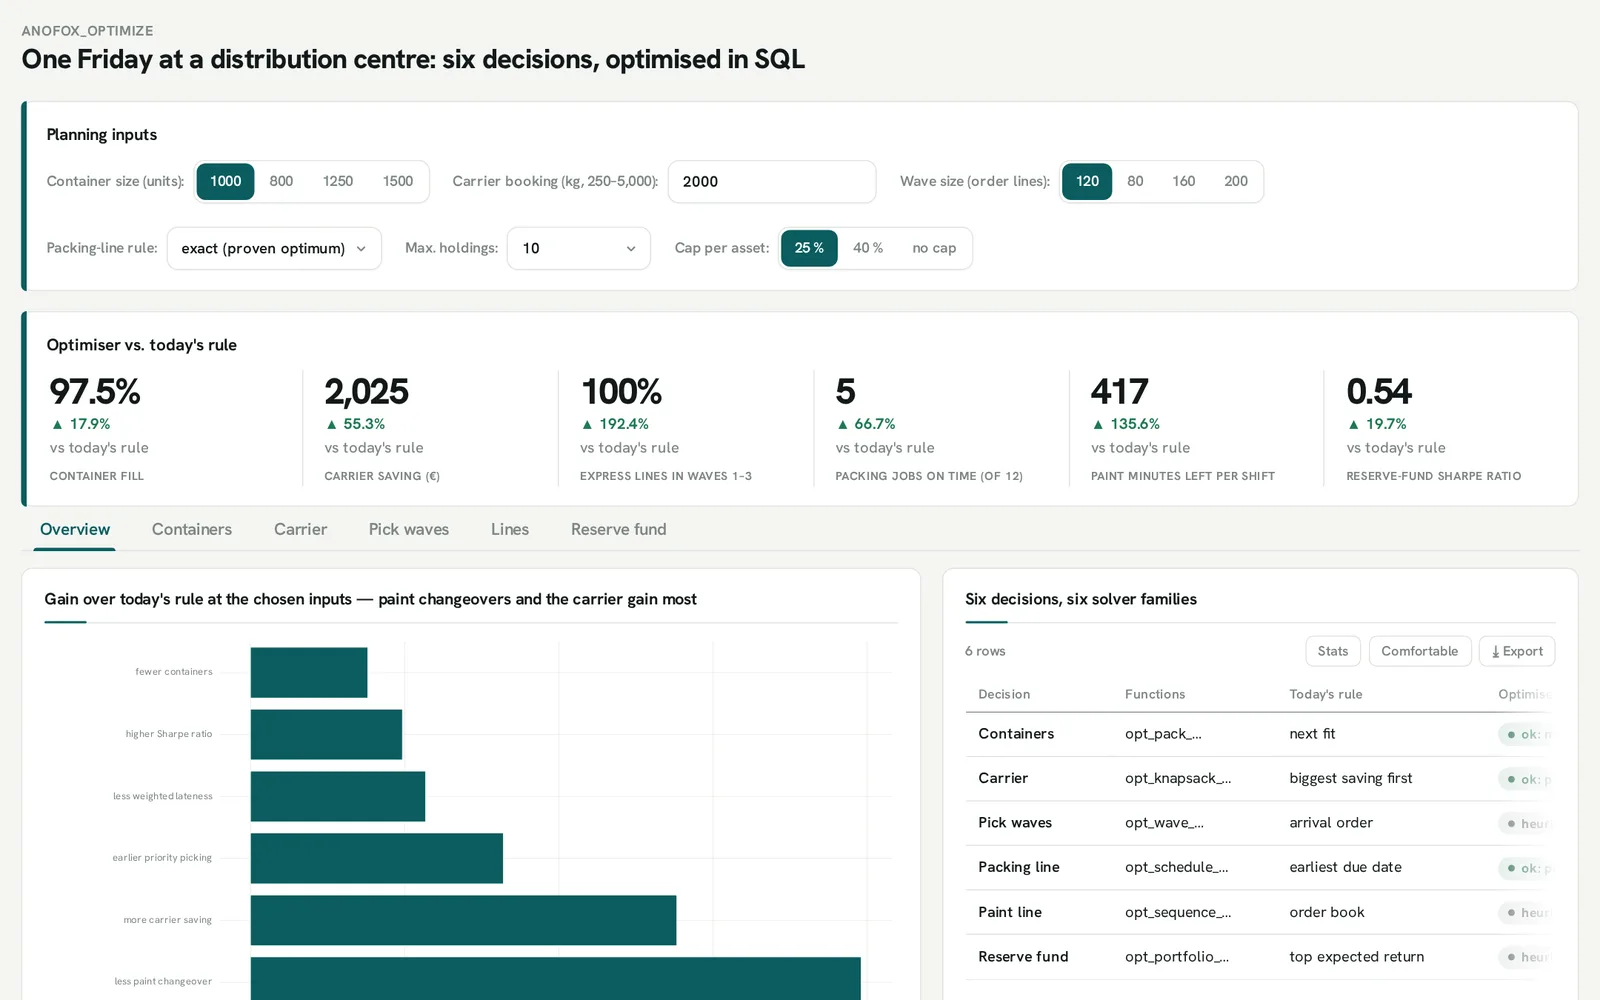
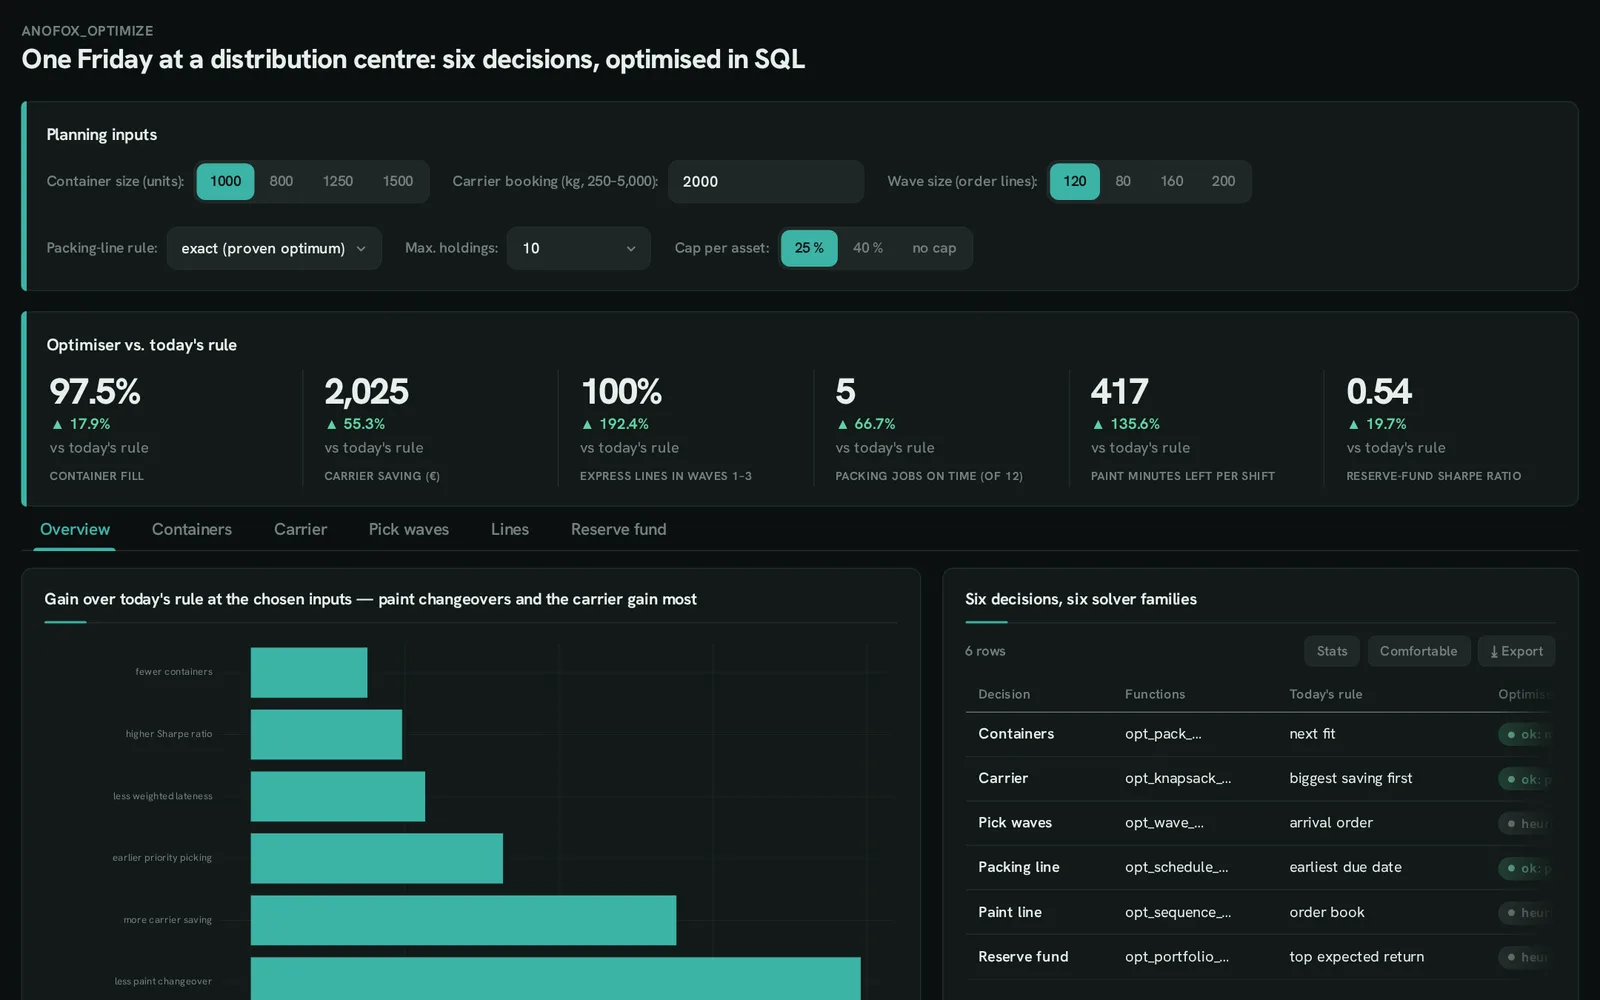
SELECT 'Overview'::TAB;
SELECT 'Headline'::GROUP;                 -- a box: KPI tiles in one stripSELECT sum(revenue) ::MONEY, 'Revenue'::LABEL FROM sales;SELECT count(*) ::METRIC, 'Orders'::LABEL FROM sales;SELECT 1::ENDGROUP;
SELECT 12::COL;                           -- the next panel is full widthSELECT week ::XAXIS, sum(revenue) ::LINECHART FROM sales GROUP BY ALL ORDER BY 1;
SELECT 8::COL;   SELECT region ::XAXIS, sum(revenue) ::BARCHART FROM sales GROUP BY ALL ORDER BY 2 DESC;SELECT 4::COL;   SELECT channel ::CATEGORY, sum(revenue) ::DONUTCHART FROM sales GROUP BY ALL;
SELECT 'Detail'::TAB;SELECT order_id ::TABLE, region, revenue FROM sales ORDER BY revenue DESC LIMIT 50;| Directive | Effect |
|---|---|
n::COL |
the next panel’s width, n of 12 |
320::HEIGHT |
the next panel’s height: pixels, a ratio ('16:9') or a share of the window ('40vh') |
n::COLUMNS |
panels per row by default |
'Title'::GROUP … 1::ENDGROUP |
one box around inputs, tiles and charts |
'Name'::TAB, 'Name'::SUBTAB |
tabs and nested tabs; a tab’s queries run when it is first opened |
'Name'::SECTION |
a heading that starts a new row |
'Name' AS id ::VIEW |
alternative views of one panel, behind a switcher |
'Title'::FIGURE … 1::ENDFIGURE |
several charts composed into one picture, with '(a / b) | c'::LAYOUT, shared axes and one legend |
'fit'::FIT |
the tab fills the window, no page scroll (wall screens, kiosks) |
'Name'::TRACK |
a thin strip under the previous chart on its x axis |
Panels before the first ::TAB form a header that stays above the tabs. -- @inputs auto at the top of the file places each input next to what it controls. Layout reference → · Figures → · Fit to screen →