
What anofox-optimize draws
Each picture is one anofox_plot(...) call on a result table of anofox-optimize, drawn in CI on every push from the extension’s latest build. Install and use it →
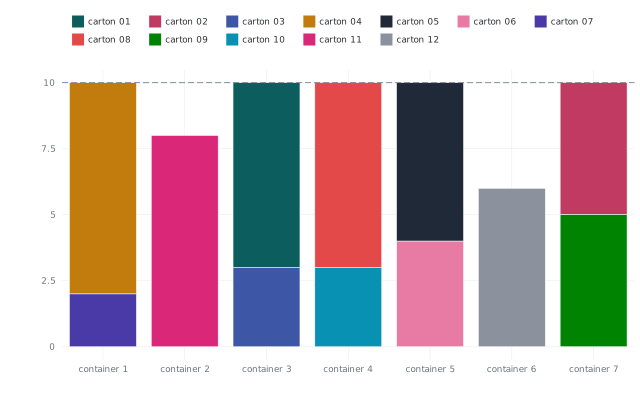
Bin packing
Section titled “Bin packing”Items stacked per container against the capacity line, drawn with roles from the solver’s STRUCT.
anofox_render (stacked bars) · anofox_optimize_pack_best_of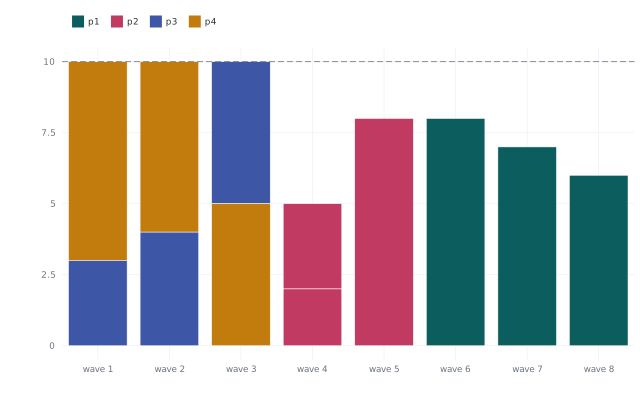
Pick waves
Section titled “Pick waves”Order lines per wave, coloured by priority, against the wave size.
anofox_render (stacked bars) · anofox_optimize_wave_best_of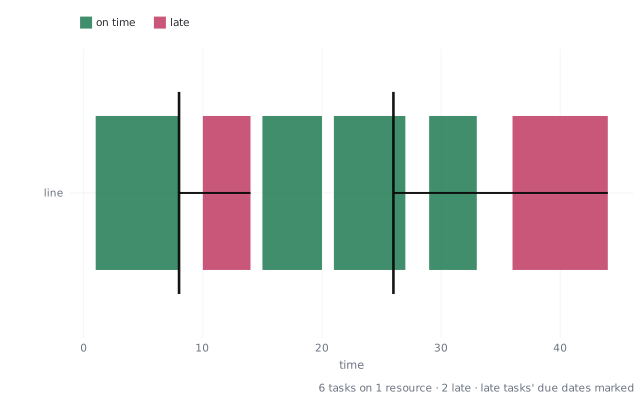
A schedule
Section titled “A schedule”Tasks per resource as a Gantt chart, late tasks red with a connector to the due date.
anofox_plot_schedule · anofox_optimize_schedule_best_of
A route
Section titled “A route”The optimised visiting order drawn on a map.
anofox_render (::MAP) · anofox_optimize_sequence_best_of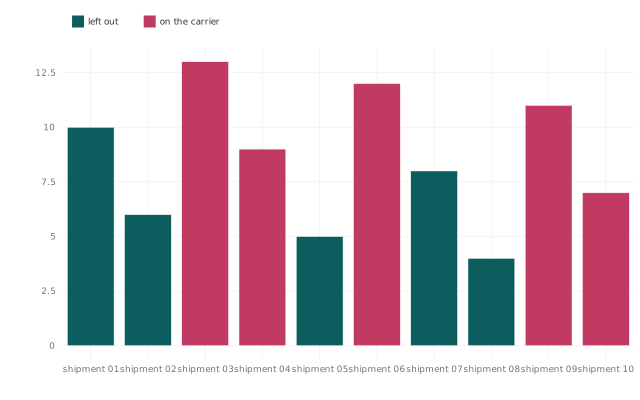
What fits the carrier
Section titled “What fits the carrier”Selected shipments against the ones left out.
anofox_render (bars) · anofox_optimize_knapsack_best_of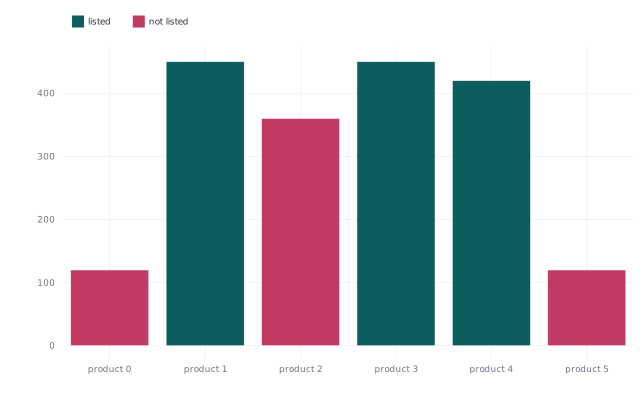
Which products to list
Section titled “Which products to list”Listed against unlisted products by expected margin.
anofox_render (bars) · anofox_optimize_assortment_best_of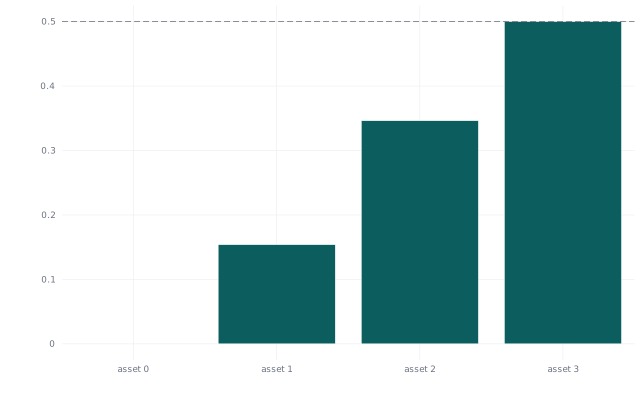
Portfolio weights
Section titled “Portfolio weights”The weight per asset of the optimised portfolio.
anofox_render (bars) · anofox_optimize_portfolio_best_of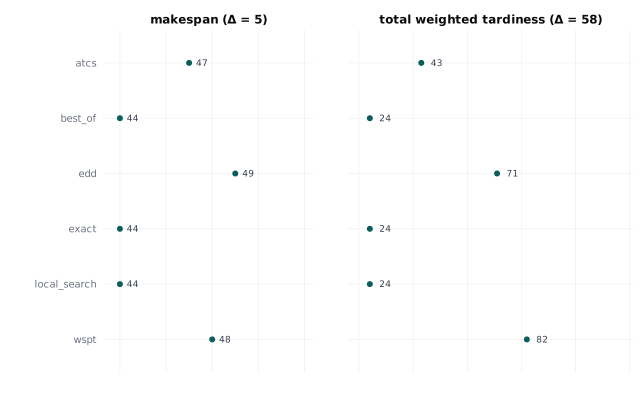
Algorithms compared
Section titled “Algorithms compared”Makespan and weighted tardiness for each scheduling rule.
anofox_plot_summary · six anofox_optimize_schedule_* rules