
::BUBBLE
Dashboards: browser · CLI · servers
Community extension: anofox_render
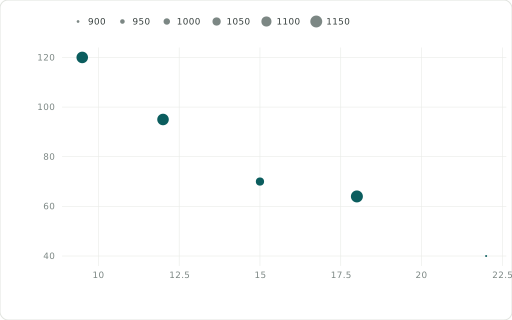
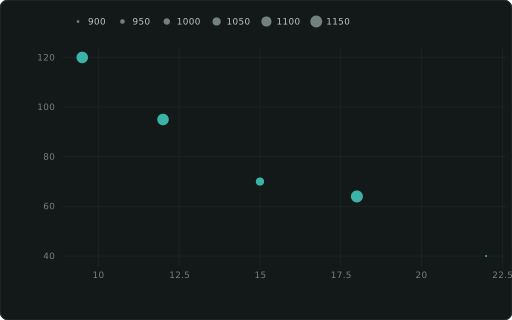
Bubble chart: alone = the y measure (size via ::SIZE); beside a ::SCATTER = its size.
Also spelled: ::BUBBLECHART
The data it needs
Section titled “The data it needs”As ::SCATTER, with a ::SIZE column for each point’s area.
SELECT price ::XAXIS, units ::BUBBLE, revenue ::SIZEFROM (VALUES (9.5,120,1140),(12,95,1140),(15,70,1050),(18,64,1152),(22,40,880)) t(price, units, revenue);