
::GANTT
Dashboards: browser · CLI · servers
Community extension: anofox_render
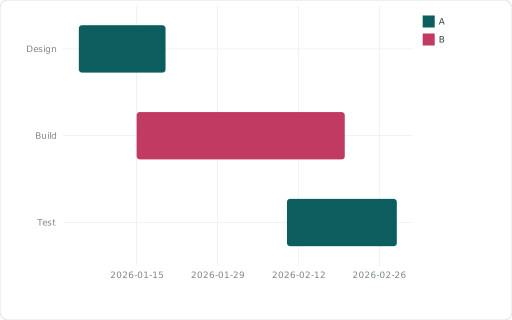
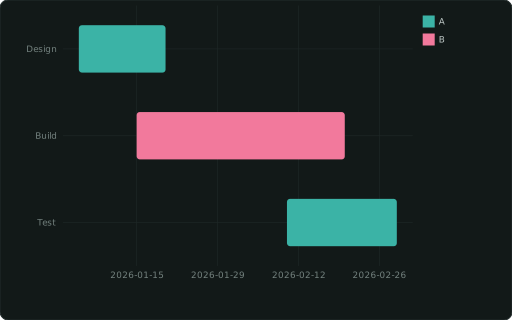
One bar per task (this column names it) from ::XMIN to ::XMAX (dates or numbers); ::CATEGORY colours the bars.
Also spelled: ::GANTTCHART, ::TIMELINE_BARS
The data it needs
Section titled “The data it needs”One row per task: this column names it, ::XMIN and ::XMAX are its start and end (dates or numbers); ::CATEGORY colours.
SELECT task ::GANTT, s ::XMIN, e ::XMAX, owner ::CATEGORYFROM (VALUES ('Design',DATE '2026-01-05',DATE '2026-01-20','A'),('Build',DATE '2026-01-15',DATE '2026-02-20','B'),('Test',DATE '2026-02-10',DATE '2026-03-01','A')) t(task, s, e, owner);In an example
Section titled “In an example”From Which chart fits which question? — open it in the builder ↗:
SELECT 6::COL; SELECT task::GANTT, s::XMIN, e::XMAX, team::CATEGORY, 'Launch plan (::GANTT)'::TITLEFROM (VALUES ('Research', DATE '2024-03-01', DATE '2024-03-15', 'Product'), ('Design', DATE '2024-03-10', DATE '2024-04-05', 'Product'), ('Build', DATE '2024-03-25', DATE '2024-05-10', 'Engineering'), ('Test', DATE '2024-05-01', DATE '2024-05-24', 'Engineering'), ('Launch', DATE '2024-05-24', DATE '2024-05-31', 'Marketing')) v(task, s, e, team)Related
Section titled “Related”::BARCHART · ::BARCHART_STACKED · ::BARCHART_PERCENT · ::BARCHART_STACKED_PERCENT · ::WATERFALL · ::BULLET · ::FUNNEL · ::PARETO