
::BARCHART
Dashboards: browser · CLI · servers
Community extension: anofox_render
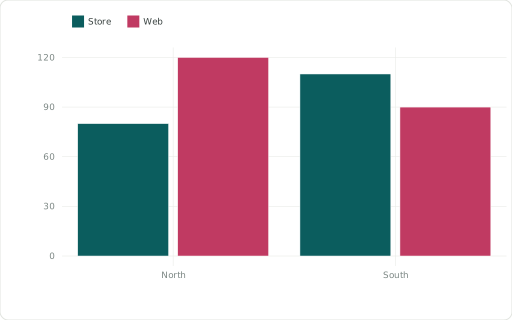
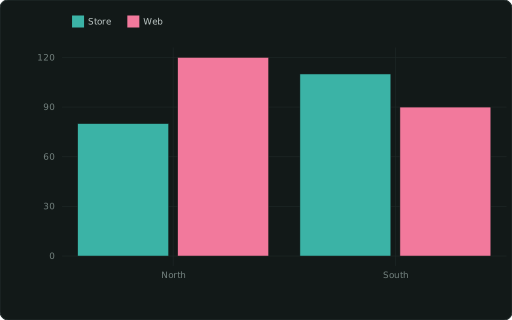
Bar chart (dodged by CATEGORY).
Also spelled: ::BAR
The data it needs
Section titled “The data it needs”One row per bar: ::XAXIS names the bar, the measure is its height. Add ::CATEGORY for bars side by side within each x.
SELECT region ::XAXIS, channel ::CATEGORY, revenue ::BARCHARTFROM (VALUES ('North','Web',120),('North','Store',80),('South','Web',90),('South','Store',110)) t(region, channel, revenue);In an example
Section titled “In an example”From Which chart fits which question? — open it in the builder ↗:
SELECT 6::COL; SELECT channel::XAXIS, sum(n)::BARCHART, TRUE::FLIP, 'Sessions by channel (horizontal, ::FLIP)'::TITLE FROM sales GROUP BY channel ORDER BY sum(n) DESCAlso in: How much will each item sell next year? · How do filters change what we see? · Which region, country and city bring the revenue? · How is revenue split by week and channel? · How will demand develop after today? · What should we order this week to sell the most?
Related
Section titled “Related”::BARCHART_STACKED · ::BARCHART_PERCENT · ::BARCHART_STACKED_PERCENT · ::WATERFALL · ::BULLET · ::FUNNEL · ::PARETO · ::GANTT