
::RIDGELINE
Dashboards: browser · CLI · servers
Community extension: anofox_render
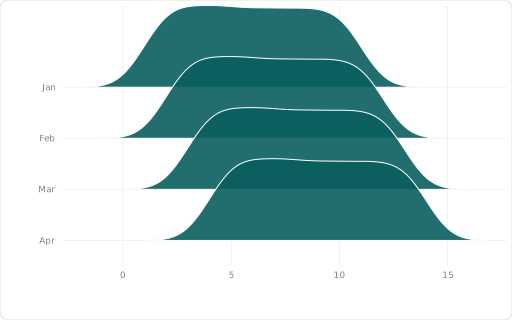
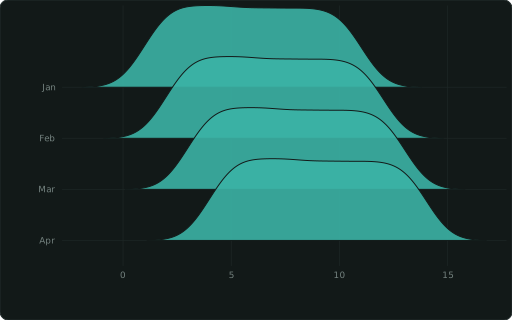
One density of the measure per ::CATEGORY, stacked as overlapping ridges (distributions over time; the first category on top).
Also spelled: ::RIDGES, ::JOYPLOT
The data it needs
Section titled “The data it needs”Raw rows: one per observation, ::CATEGORY per ridge (the first category on top).
SELECT month ::CATEGORY, (i * 7919) % 100 / 10.0 + mo ::RIDGELINEFROM range(0, 150) r(i), (VALUES (1,'Jan'),(2,'Feb'),(3,'Mar'),(4,'Apr')) t(mo, month);In an example
Section titled “In an example”From Which chart fits which question? — open it in the builder ↗:
SELECT 6::COL; SELECT month::CATEGORY, delay::RIDGELINE, 'Delivery delays drift up from January to April (::RIDGELINE)'::TITLEFROM (SELECT ['Jan','Feb','Mar','Apr'][1 + i % 4] AS month, (i % 4) * 0.8 + ((i * 37) % 50) / 10.0 AS delay FROM range(400) t(i))Related
Section titled “Related”::HISTOGRAM · ::DENSITY · ::BOXPLOT · ::VIOLIN · ::QQ