
::REGION
Dashboards: browser · CLI · servers
Community extension: anofox_render
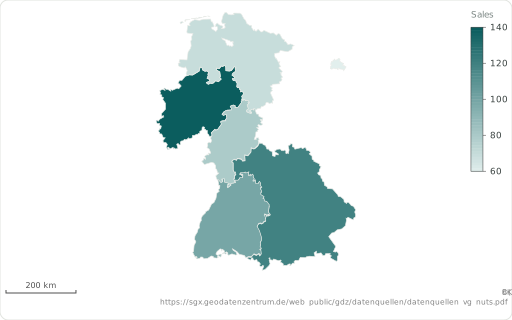
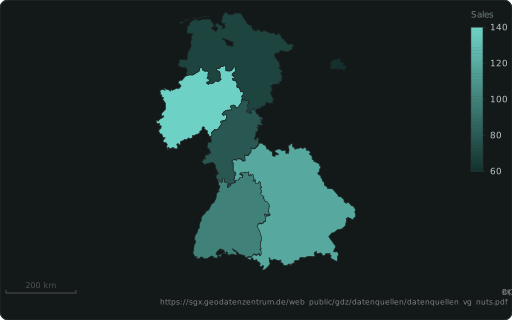
A map region by code, drawn from the built-in boundaries: ISO 3166-1 (‘DE’, ‘DEU’), ISO 3166-2 (‘DE-BY’, ‘US-CA’: states and provinces everywhere), German AGS (‘09162’) or NUTS (‘DE212’), else a name.
Also spelled: ::REGION_CODE, ::ISO_CODE
The data it needs
Section titled “The data it needs”One row per region: a code ('DE', 'DE-BY', an AGS '09162', NUTS 'DE212') — the boundary is built in — and a measure to colour it.
SELECT code ::REGION, v AS "Sales" ::BARCHARTFROM (VALUES ('DE-BY',120),('DE-BW',100),('DE-NW',140),('DE-NI',70),('DE-HE',80),('DE-BE',60)) t(code, v);In an example
Section titled “In an example”From Which chart fits which question? — open it in the builder ↗:
SELECT iso3 ::REGION, -- ISO 3166 code → the built-in countries population AS "Population" ::BARCHART, 'quantile 5'::CLASSES, -- five classes of equal size 12 ::LABEL_TOP, -- name the 12 most populous 'Where do most people live?'::TITLEFROM 'data/maps/world-population.csv'WHERE iso3 <> 'ATA'Also in: Where do our deliveries and customers cluster, and which regions are underserved? · Where does our revenue come from, from country down to district?