
What anofox-tabular draws
Each picture is one anofox_plot(...) call on a result table of anofox-tabular, drawn in CI on every push from the extension’s latest build. Install and use it →
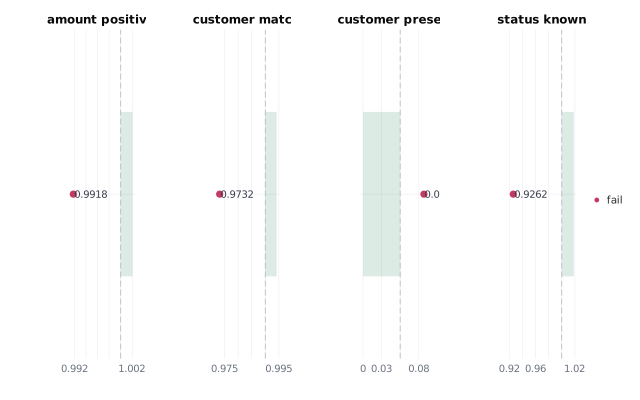
A data-quality board
Section titled “A data-quality board”One panel per check: the value against its acceptance band, coloured by status.
anofox_plot_checks · anofox_tab_run_checks
One check
Section titled “One check”A single check’s value against its threshold.
anofox_plot_checks · null_rate
Checks compared
Section titled “Checks compared”Several one-row checks as one summary.
anofox_plot_summary · compliance, match_rate, null_rate, …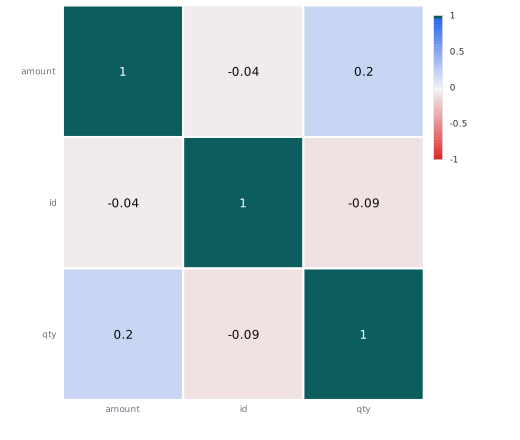
Correlation matrix
Section titled “Correlation matrix”A profile’s correlations on a diverging scale, values in the cells.
anofox_plot_matrix · anofox_tab_profile_correlations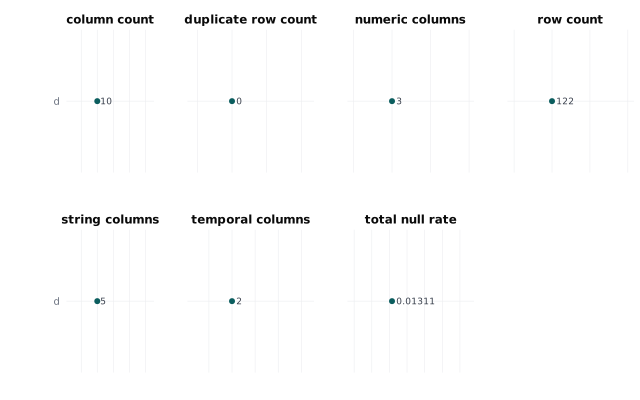
Table profile
Section titled “Table profile”Row and column counts, null rates and duplicates at a glance.
anofox_plot_summary · anofox_tab_profile_summary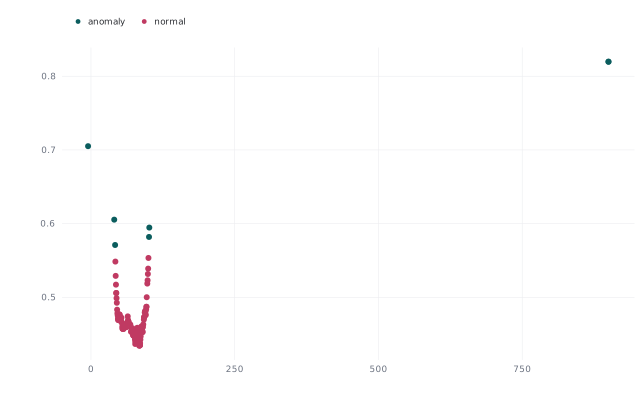
Anomaly scores
Section titled “Anomaly scores”Isolation-forest scores per row, anomalies coloured.
anofox_render · anofox_tab_isolation_forest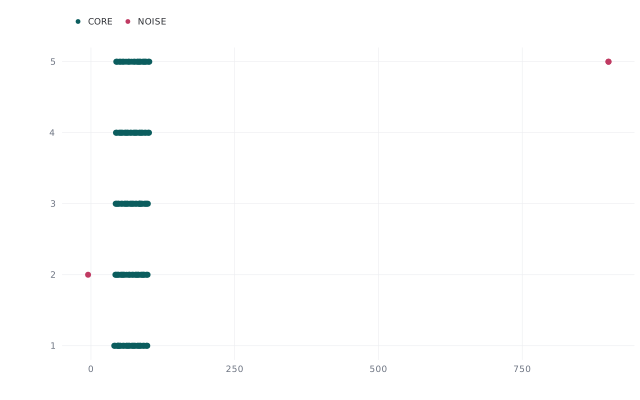
Clusters and noise
Section titled “Clusters and noise”DBSCAN core points and noise per cluster.
anofox_render · anofox_tab_dbscan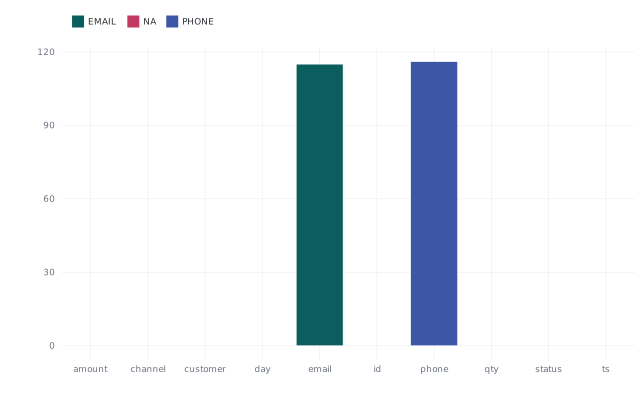
Personal data found
Section titled “Personal data found”PII matches per column and kind (e-mail, phone, …).
anofox_render · anofox_tab_pii_scan_table