
::PARETO
Dashboards: browser · CLI · servers
Community extension: anofox_render
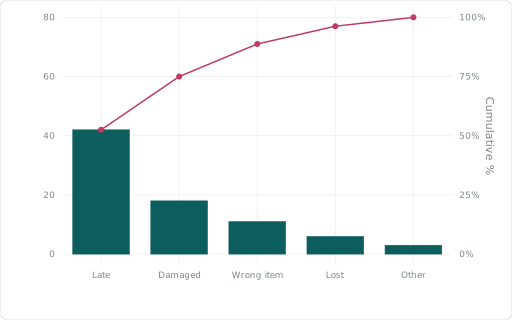
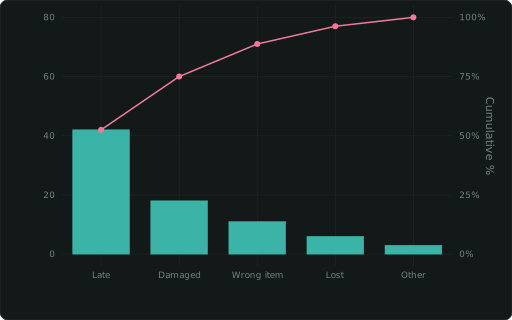
XAXIS categories as bars sorted largest first, with the cumulative share as a line on a 0–100 % right axis.
Also spelled: ::PARETOCHART
The data it needs
Section titled “The data it needs”One row per category: ::XAXIS and the measure. The bars are sorted largest first, with the cumulative share as a line.
SELECT cause ::XAXIS, n ::PARETOFROM (VALUES ('Late',42),('Damaged',18),('Wrong item',11),('Lost',6),('Other',3)) t(cause, n);In an example
Section titled “In an example”From Which chart fits which question? — open it in the builder ↗:
SELECT 6::COL; SELECT reason::XAXIS, n::PARETO, 'Three reasons cause most returns (::PARETO)'::TITLEFROM (VALUES ('Wrong size', 48), ('Damaged', 21), ('Late', 14), ('Not as shown', 9), ('Changed mind', 5), ('Other', 3)) v(reason, n)Related
Section titled “Related”::BARCHART · ::BARCHART_STACKED · ::BARCHART_PERCENT · ::BARCHART_STACKED_PERCENT · ::WATERFALL · ::BULLET · ::FUNNEL · ::GANTT