
::BULLET
Dashboards: browser · CLI · servers
Community extension: anofox_render
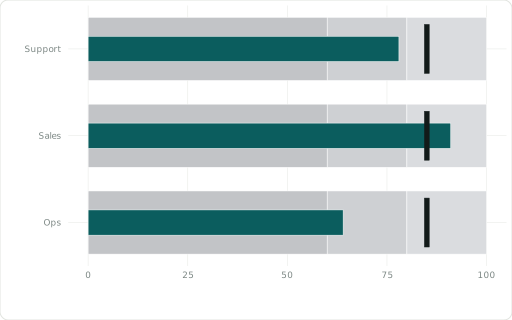
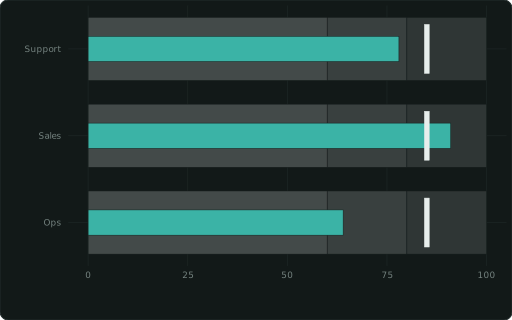
Measure per XAXIS row vs a ::GOAL tick over ::RANGE bands ‘60,80,100’.
Also spelled: ::BULLETCHART
The data it needs
Section titled “The data it needs”One row per item: ::XAXIS names it, the measure is the bar, ::GOAL the tick, ::RANGE '60,80,100' the bands.
SELECT team ::XAXIS, score ::BULLET, 85 ::GOAL, '60,80,100' ::RANGEFROM (VALUES ('Support',78),('Sales',91),('Ops',64)) t(team, score);In an example
Section titled “In an example”From Which chart fits which question? — open it in the builder ↗:
SELECT 6::COL; SELECT region::XAXIS, attained::BULLET, goal::GOAL, '60,85,110'::RANGE, '%'::YFORMAT, 'Two regions short of target'::TITLEFROM (VALUES (1, 'North', 92, 90), (2, 'South', 71, 85), (3, 'East', 104, 95), (4, 'West', 66, 80)) t(i, region, attained, goal) ORDER BY iAlso in: What should we order this week to sell the most?
Related
Section titled “Related”::BARCHART · ::BARCHART_STACKED · ::BARCHART_PERCENT · ::BARCHART_STACKED_PERCENT · ::WATERFALL · ::FUNNEL · ::PARETO · ::GANTT