
Inputs and filters
An input’s column name is a DuckDB variable; every query that reads it with getvariable() re-runs when it changes. Each tile below is an input and a chart that reads it.
The sample data every tile on this page uses
CREATE TABLE sales ASSELECT DATE '2026-11-02' - (29 - w)::INTEGER * 7 AS week, region, channel, round(80 + w * 3 + (CASE region WHEN 'North' THEN 30 WHEN 'South' THEN 10 ELSE 0 END) + (CASE channel WHEN 'Web' THEN 25 ELSE 0 END) + 10 * sin(w / 2.0 + length(region))) AS revenueFROM range(0, 30) r(w), (VALUES ('North'), ('South'), ('West')) a(region), (VALUES ('Web'), ('Store')) b(channel);SELECT 1::COLUMNS;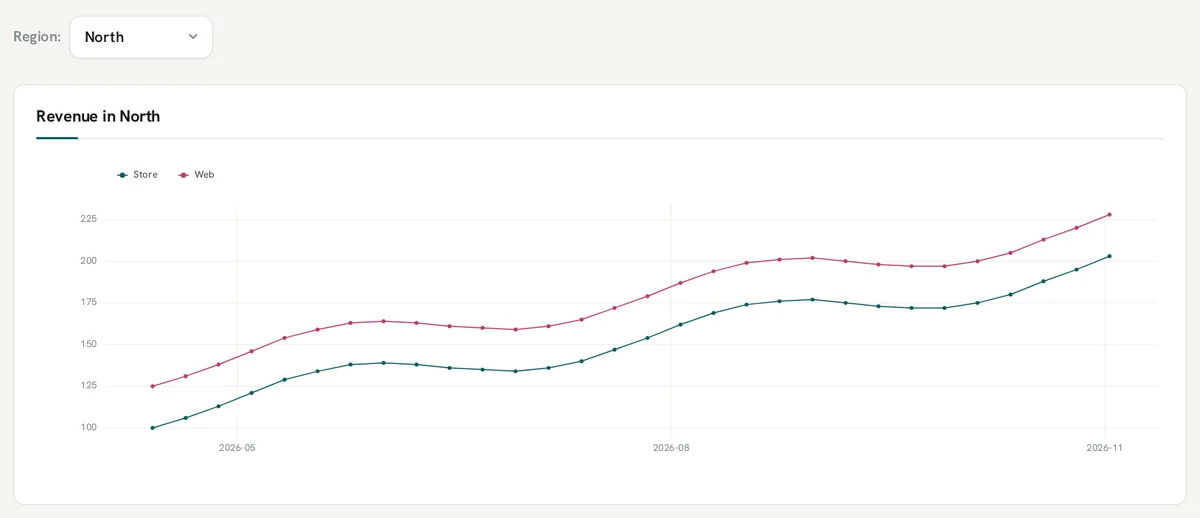
Dropdown
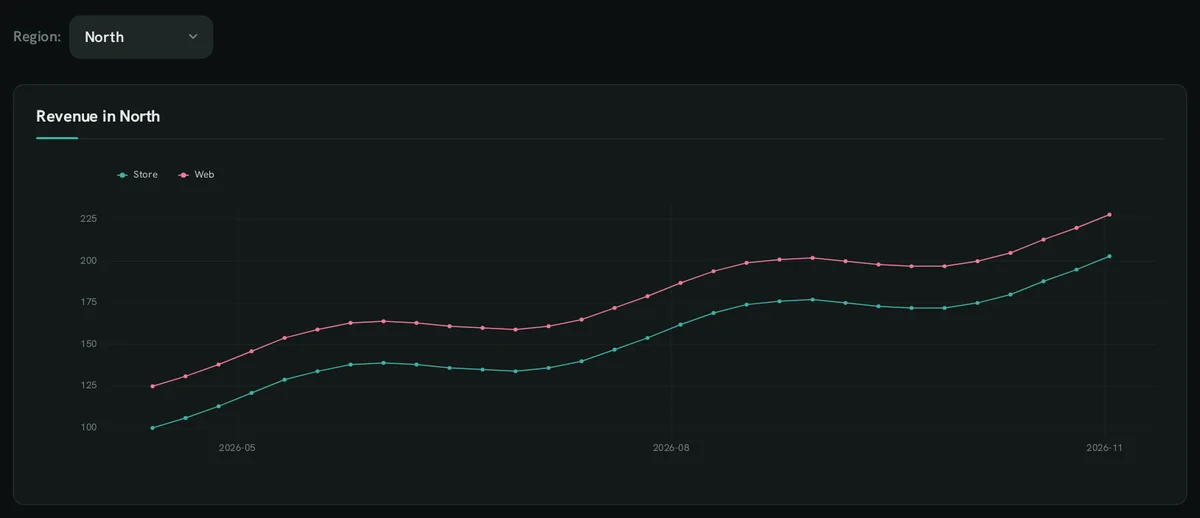
Section titled “Dropdown”One choice from a query’s rows; the column name region is the variable.
SELECT DISTINCT region ::DROPDOWN, 'Region'::LABEL FROM sales ORDER BY 1;SELECT week ::XAXIS, channel ::CATEGORY, sum(revenue) ::LINECHART, ('Revenue in ' || getvariable('region'))::TITLEFROM sales WHERE region = getvariable('region') GROUP BY ALL ORDER BY 1;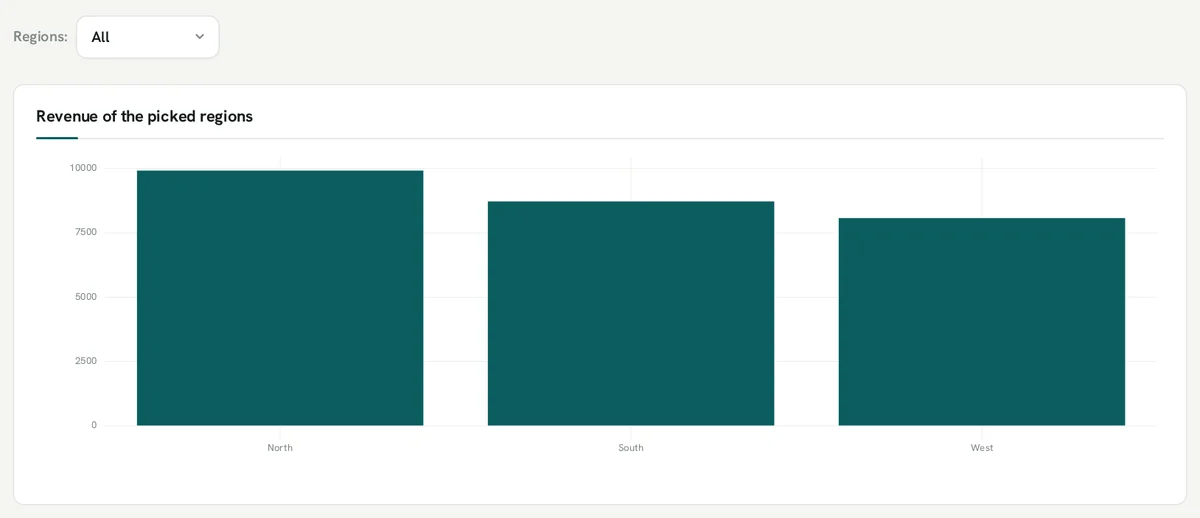
Multi-select
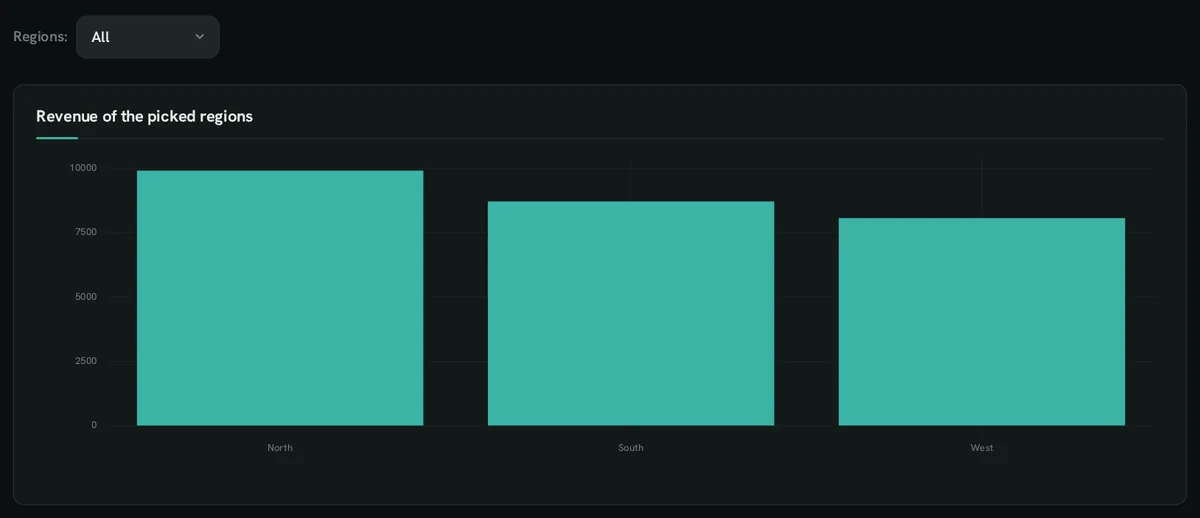
Section titled “Multi-select”Several choices as a list: list_contains(getvariable('regions'), region).
SELECT DISTINCT region AS regions ::MULTISELECT, 'Regions'::LABEL FROM sales ORDER BY 1;SELECT region ::XAXIS, sum(revenue) ::BARCHART, 'Revenue of the picked regions'::TITLEFROM sales WHERE list_contains(getvariable('regions'), region) GROUP BY ALL ORDER BY 2 DESC;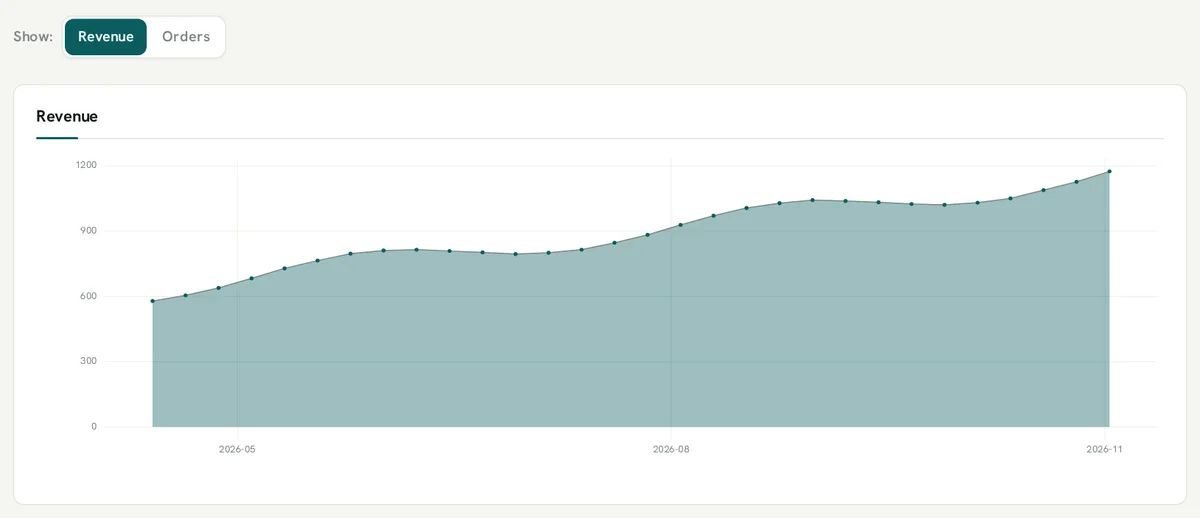
Buttons as a metric switcher
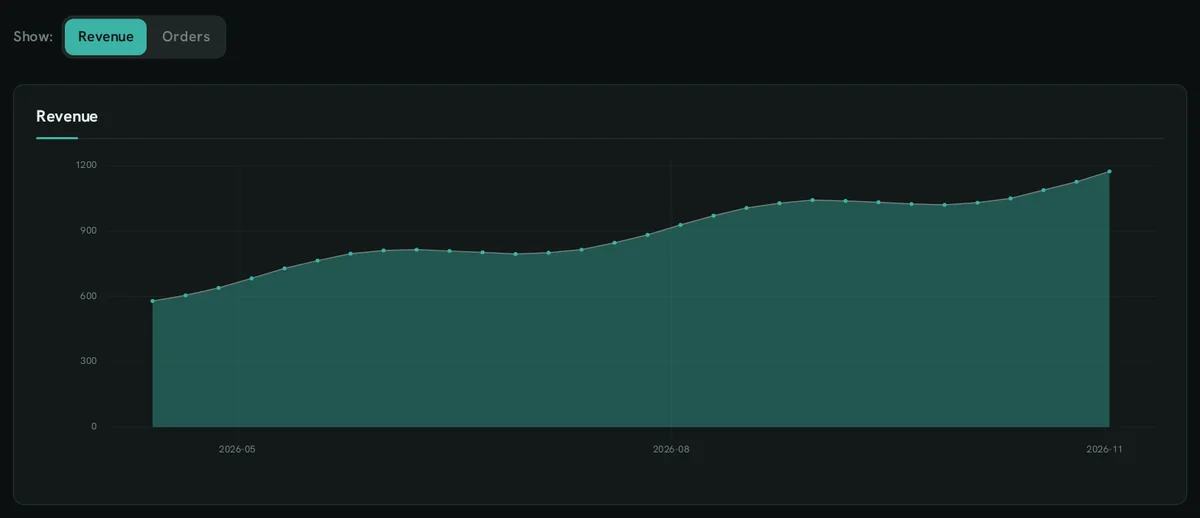
Section titled “Buttons as a metric switcher”A segmented group for a handful of options; CASE picks the measure.
SELECT m AS metric ::BUTTONS, 'Show'::LABEL FROM (VALUES (1, 'Revenue'), (2, 'Orders')) t(o, m) ORDER BY o;SELECT week ::XAXIS, CASE getvariable('metric') WHEN 'Orders' THEN count(*) * 12 ELSE sum(revenue) END ::AREACHART, getvariable('metric')::TITLEFROM sales GROUP BY ALL ORDER BY 1;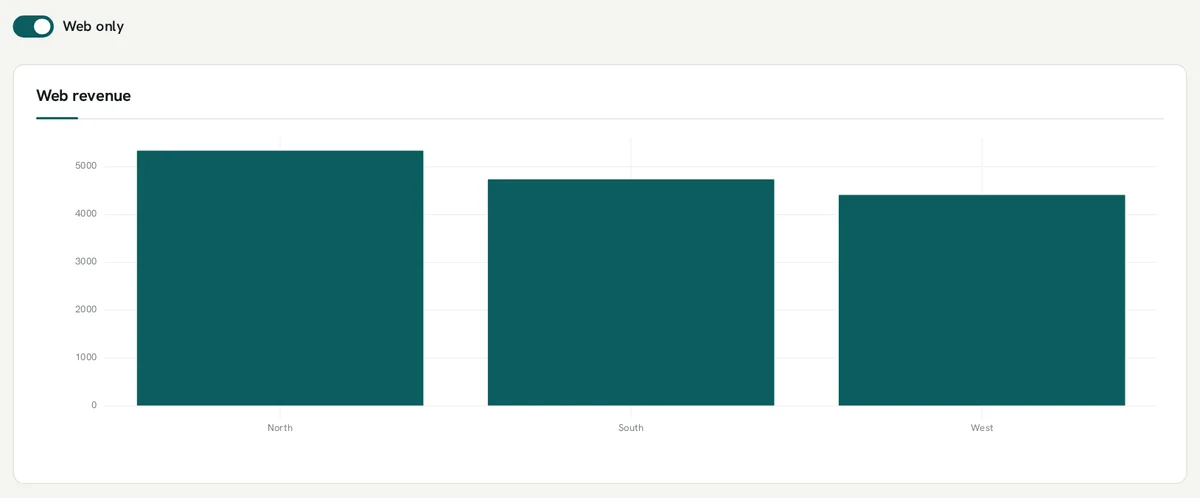
Toggle
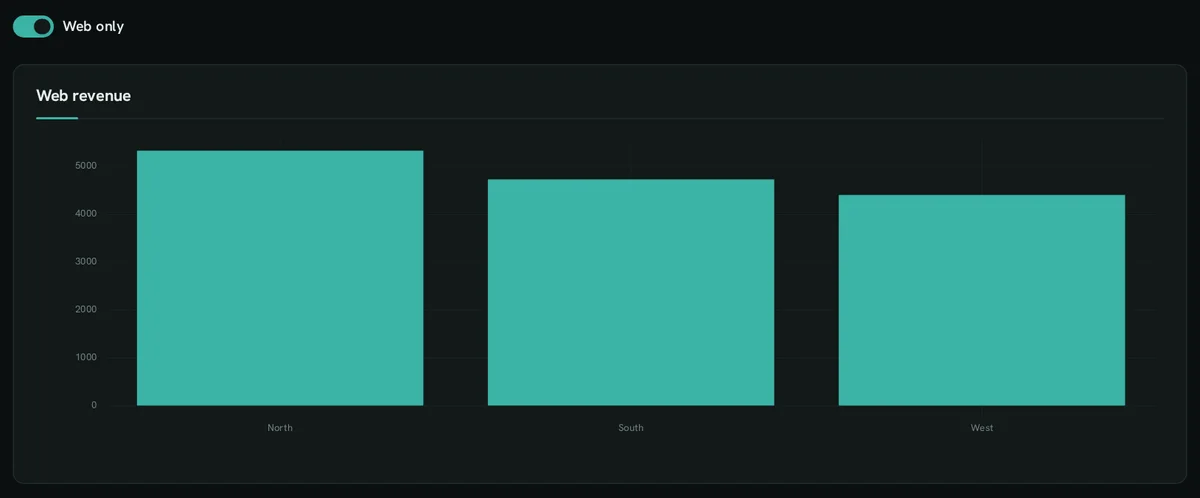
Section titled “Toggle”An on/off switch → a BOOLEAN variable.
SELECT true AS web_only ::TOGGLE, 'Web only'::LABEL;SELECT region ::XAXIS, sum(revenue) ::BARCHART, CASE WHEN getvariable('web_only') THEN 'Web revenue' ELSE 'All revenue' END ::TITLEFROM sales WHERE NOT getvariable('web_only') OR channel = 'Web' GROUP BY ALL ORDER BY 2 DESC;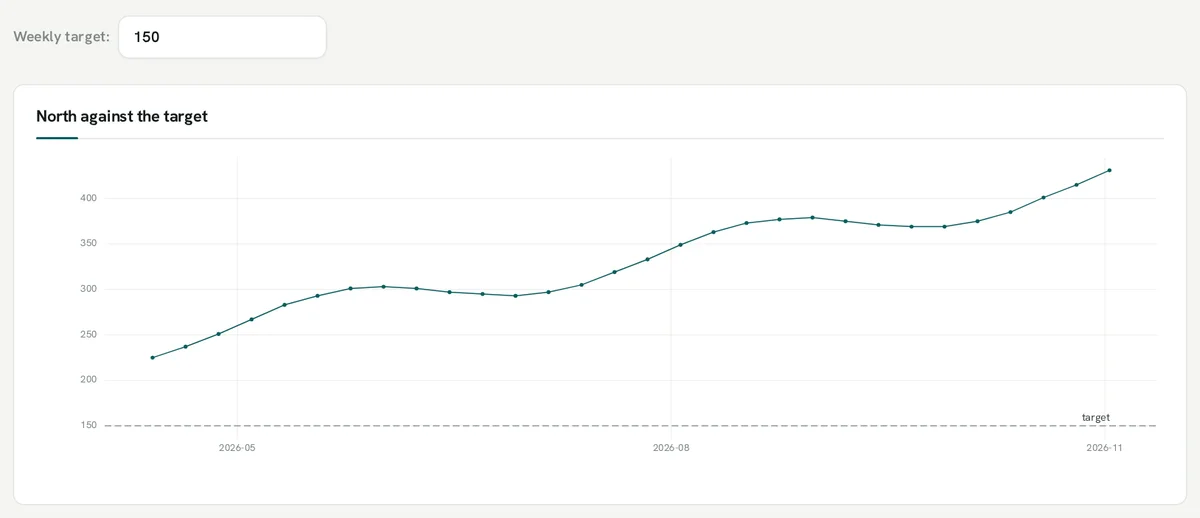
Number
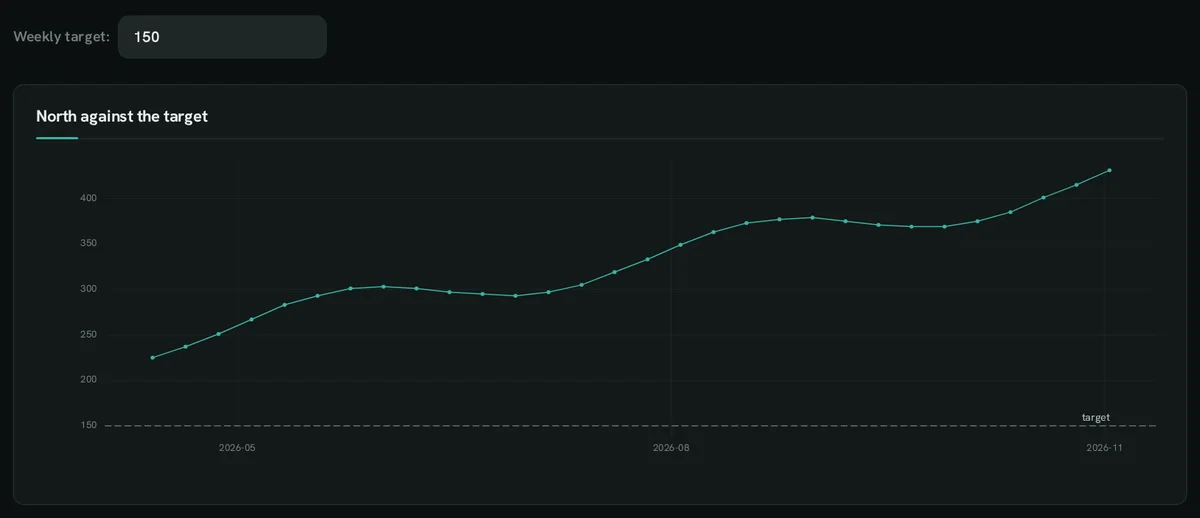
Section titled “Number”A number with its default; here a threshold the chart draws as a line.
SELECT 150 AS target ::NUMBER, 'Weekly target'::LABEL;SELECT week ::XAXIS, sum(revenue) FILTER (WHERE region = 'North') ::LINECHART, getvariable('target') ::REFLINE, 'target'::REFLINE_LABEL, 'North against the target'::TITLE FROM sales GROUP BY week ORDER BY 1;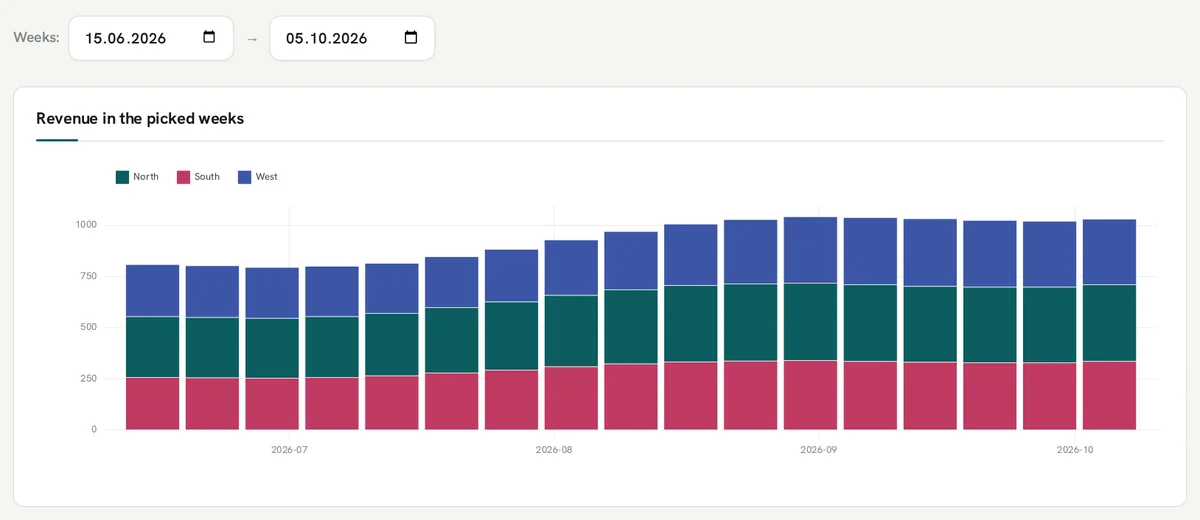
Date range
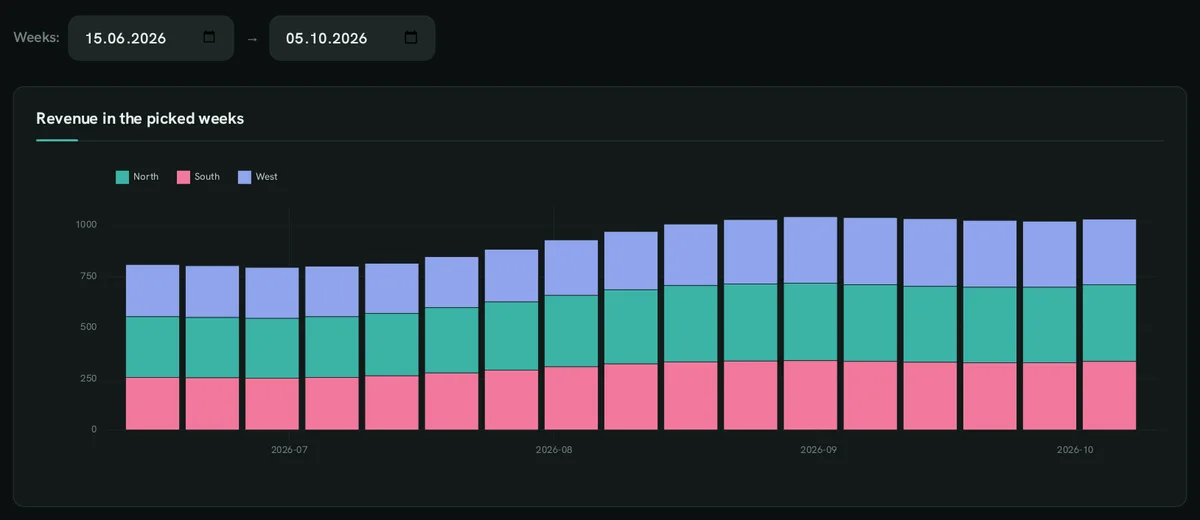
Section titled “Date range”Two date columns → from_day / to_day.
SELECT DATE '2026-06-15' AS from_day, DATE '2026-10-05' AS to_day ::DATERANGE, 'Weeks'::LABEL;SELECT week ::XAXIS, region ::CATEGORY, sum(revenue) ::BARCHART_STACKED, 'Revenue in the picked weeks'::TITLEFROM sales WHERE week BETWEEN getvariable('from_day')::DATE AND getvariable('to_day')::DATE GROUP BY ALL ORDER BY 1;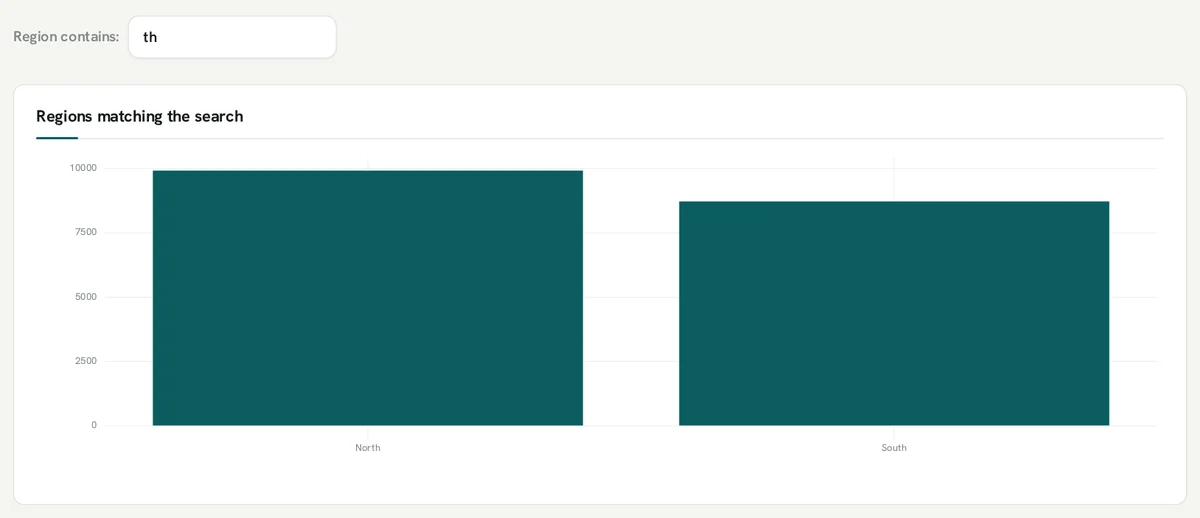
Text search
Section titled “Text search”Free text; here it filters by a substring.
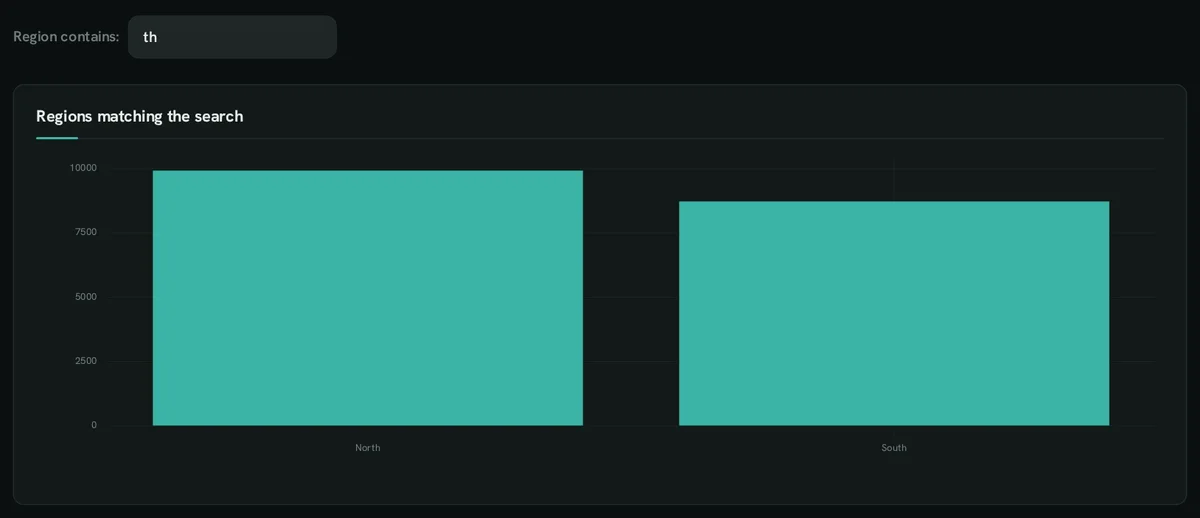
SELECT 'th' AS q ::TEXT, 'Region contains'::LABEL;SELECT region ::XAXIS, sum(revenue) ::BARCHART, 'Regions matching the search'::TITLEFROM sales WHERE region ILIKE '%' || getvariable('q') || '%' GROUP BY ALL ORDER BY 2 DESC;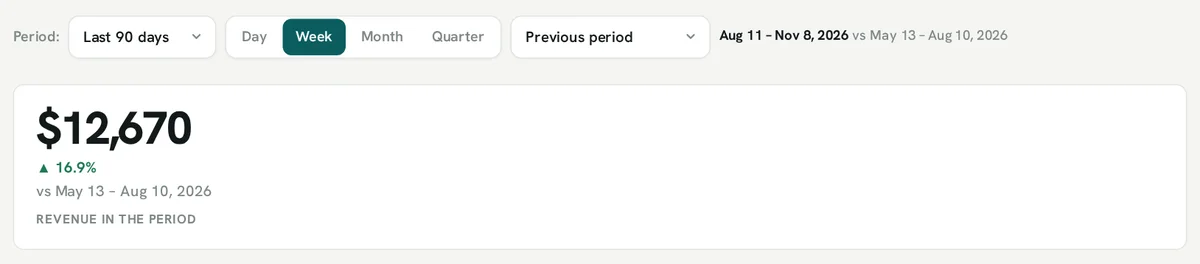
Period with comparison
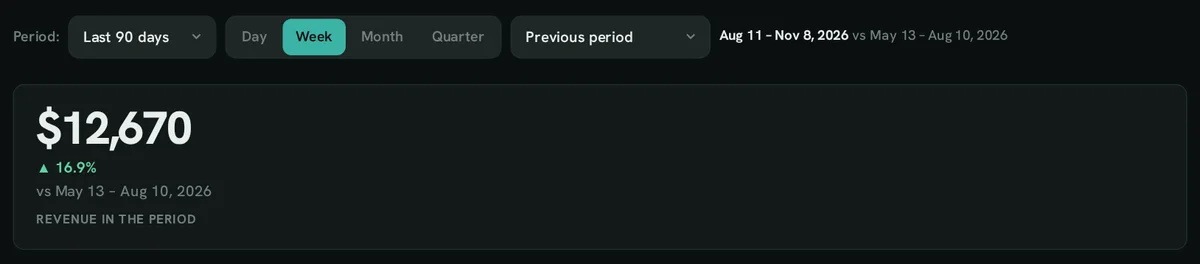
Section titled “Period with comparison”Presets, a grain and a comparison period → p_from, p_to, p_prev_from, … for KPIs with a change.
SELECT 'presets=30d,90d,ytd; default=90d' AS p ::PERIOD;SELECT sum(revenue) FILTER (WHERE week BETWEEN getvariable('p_from')::DATE AND getvariable('p_to')::DATE) ::MONEY, sum(revenue) FILTER (WHERE week BETWEEN getvariable('p_prev_from')::DATE AND getvariable('p_prev_to')::DATE) ::DELTA, getvariable('p_prev_label') ::DELTA_LABEL, 'Revenue in the period'::LABEL FROM sales;