
::DIAGRAM
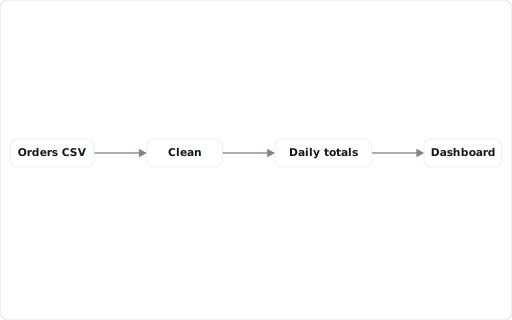
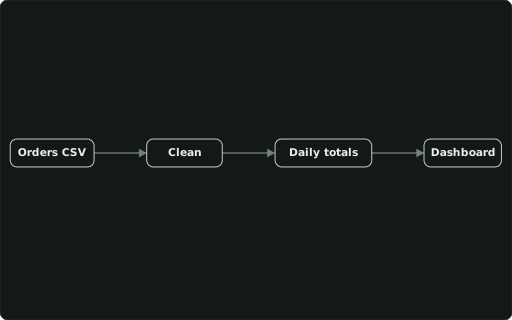
Node/edge diagram, one row per node (this column = the id; ::LABEL, a KPI format, ::BADGE in the box; edges from ::UPSTREAM / ::EDGES).
Also spelled: ::NODE
The data it needs
Section titled “The data it needs”One row per node: this column is its id, ::LABEL its text, ::UPSTREAM its input id(s) — or all edges at once with ::EDGES; ::LANE groups nodes in swimlanes.
SELECT id ::DIAGRAM, label ::LABEL, up ::UPSTREAMFROM (VALUES ('src','Orders CSV',NULL),('clean','Clean','src'),('agg','Daily totals','clean'),('dash','Dashboard','agg')) t(id, label, up);In an example
Section titled “In an example”From Where does our supply chain amplify demand, and what would stabilise it? — open it in the builder ↗:
WITH s AS ( SELECT st.stage_no, st.stage, st.title, st.short, CASE WHEN st.stage = 'Consumers' THEN 1.0 ELSE c.bullwhip END AS ratio, c.order_max, c.order_peak_week, c.weeks_at_capacity, c.weeks_short, c.peak_backlog, c.late_shipments, (SELECT list(CASE WHEN st.stage = 'Consumers' THEN r.consumer_demand ELSE r.order_out END ORDER BY r.week) FROM sc_run() r WHERE r.stage = CASE WHEN st.stage = 'Consumers' THEN 'Retailer' ELSE st.stage END) AS orders FROM sc_stage st LEFT JOIN sc_cur() c USING (stage)),d AS (SELECT max(consumer_demand) AS peak, arg_max(week, consumer_demand) AS peak_week, round(stddev_samp(consumer_demand)) AS sd FROM sc_run() WHERE stage = 'Retailer')SELECT s.stage ::DIAGRAM, s.title ::LABEL, round(s.ratio, 1) ::METRIC, '<3:good; <8:warn; bad'::THRESHOLDS, s.orders ::SPARKLINE, CASE s.stage WHEN 'Consumers' THEN 'Consumers buy up to ' || d.peak::INTEGER || ' units in week ' || d.peak_week || ' (± ' || d.sd::INTEGER || ' a week): the only real demand in the chain' ELSE s.title || ' orders vary ' || round(s.ratio, 1) || '× as much as consumer sales; its largest order, ' || s.order_max::INTEGER || ' units, goes out in week ' || s.order_peak_week || CASE WHEN s.stage = 'Factory' AND s.weeks_at_capacity > 0 THEN '; production runs at its 150-unit limit in ' || s.weeks_at_capacity || ' weeks' ELSE '' END ||-- …Also in: How does data move through our pipeline?
Factor graphs
Section titled “Factor graphs”anofox_plot_factor_graph(nodes, edges := …, marginals := …, schedule := …) draws a Bayesian model as a Forney-style factor graph through ::DIAGRAM: factors as boxes, variables as circles, observations filled, layers as bands, and what the model learned under the graph. Hovering a variable shows its posterior; Step / Play walk the messages the inference passed. The tables are what an inference library exports: one row per node, one per edge. Factor graphs are a plugin that the builder and the release ship: a dashboard that draws one starts with SELECT 'factor-graph'::REQUIRES;.
A small one in the gallery ↗ · three models in the builder ↗