
::LINECHART
Dashboards: browser · CLI · servers
Community extension: anofox_render
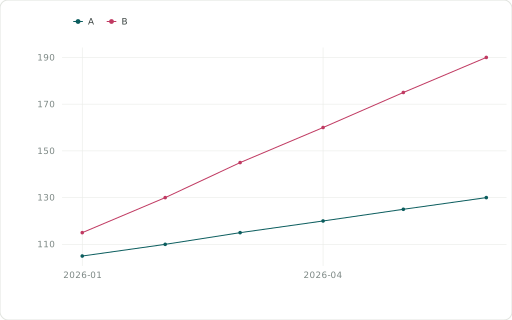
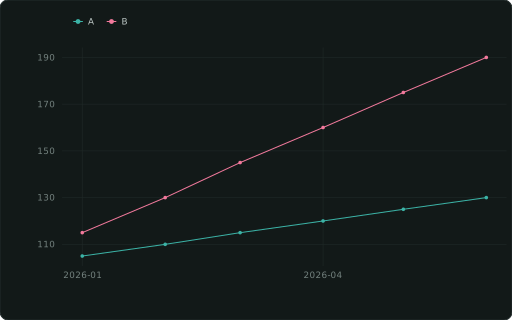
Line chart.
Also spelled: ::LINE
The data it needs
Section titled “The data it needs”One row per point: ::XAXIS (usually a date), the measure as y; ::CATEGORY draws one line per value. Rows need not be sorted.
SELECT m ::XAXIS, s ::CATEGORY, 100 + 10 * month(m) * (s = 'B')::INT + 5 * month(m) ::LINECHARTFROM range(DATE '2026-01-01', DATE '2026-07-01', INTERVAL 1 MONTH) r(m), (VALUES ('A'), ('B')) c(s);In an example
Section titled “In an example”From Where do our sessions come from? — open it in the builder ↗:
SELECT '**How it works:** every panel is a SQL query whose columns are tagged with `::ROLE` casts — `::XAXIS`, `::CATEGORY`, a chart kind like `::BARCHART_STACKED`, `::PIE`, `::LINECHART`, `::TABLE`, or a KPI (`::COMPACT`/`::METRIC`). Un-annotated statements (the `CREATE TABLE`) are setup. **Click a pie slice or a table row** — the KPI strip filters via `getvariable(''selected'')`.'::MARKDOWN, 'What this shows'::TITLEAlso in: Can we build a dashboard without a data source? · Which chart fits which question? · How much will each item sell next year? · Which forecast method fits our demand? · How do filters change what we see? · Which region, country and city bring the revenue?
Related
Section titled “Related”::LINECHART_PERCENT · ::STEP · ::SMOOTH · ::AREACHART · ::AREACHART_STACKED · ::CANDLESTICK · ::SPARKLINE · ::SPARKBAR