
What anofox-statistics draws
Each picture is one anofox_plot(...) call on a result table of anofox-statistics, drawn in CI on every push from the extension’s latest build. Install and use it →
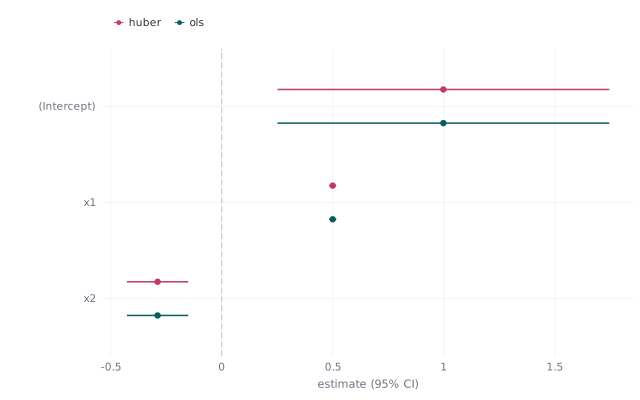
Coefficients of two models
Section titled “Coefficients of two models”A coefficient forest with 95 % intervals; two estimators dodged, a term whose interval crosses 0 fades.
anofox_plot_terms · ols_tidy_by ∪ huber_tidy_by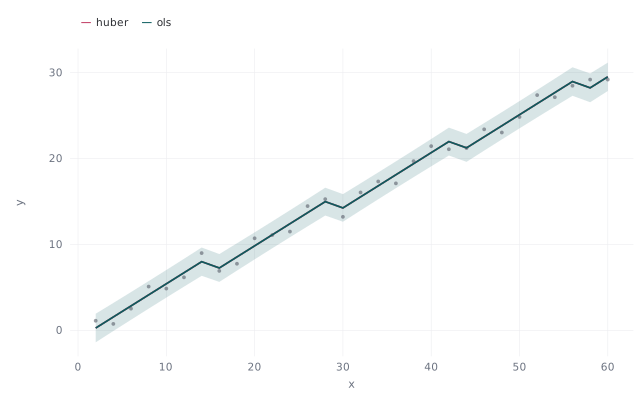
Fit and prediction band
Section titled “Fit and prediction band”Observed points, each model’s fit and the reference model’s prediction band.
anofox_plot_prediction · ols_prediction_by ∪ huber_prediction_by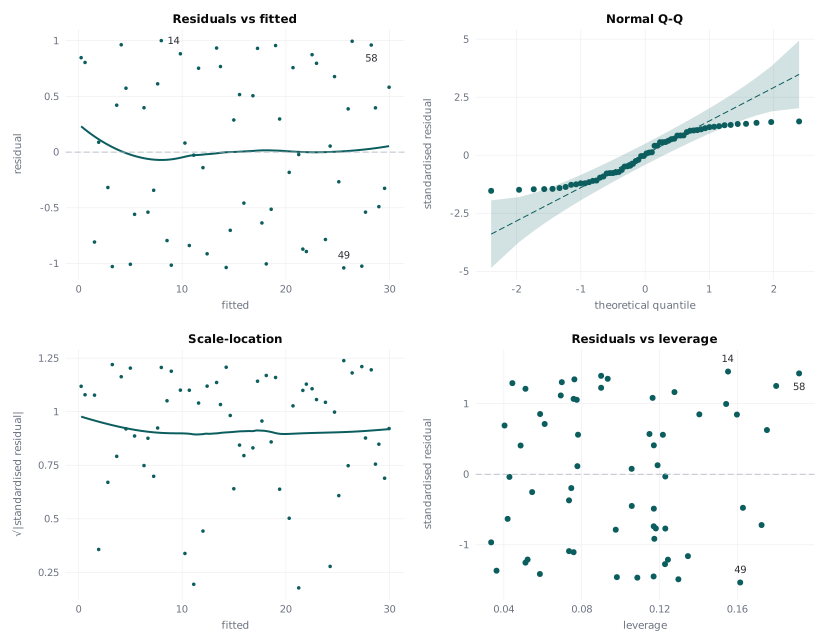
Regression diagnostics
Section titled “Regression diagnostics”The plot.lm 2×2 in one picture: residuals, normal Q-Q, scale-location, leverage.
anofox_plot_diagnostics · ols_augment_by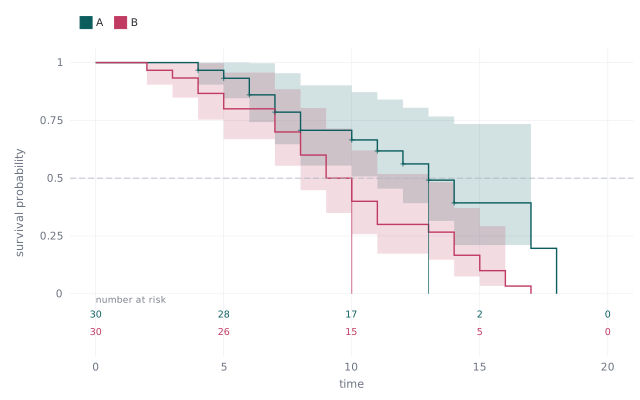
Survival curves
Section titled “Survival curves”Kaplan–Meier steps with bands, censor marks, the median line and a number-at-risk table.
anofox_plot_curve · kaplan_meier_by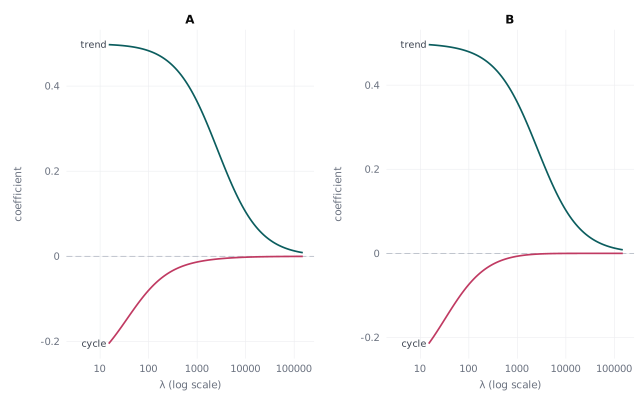
Regularisation path
Section titled “Regularisation path”Every coefficient along λ on a log axis, labelled at its line end.
anofox_plot_terms · ridge_path_by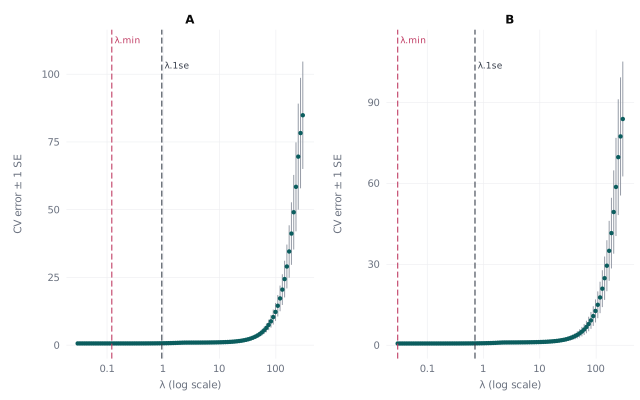
Cross-validated λ
Section titled “Cross-validated λ”CV error ± one SE with λ.min and λ.1se marked.
anofox_plot_curve · elasticnet_cv_by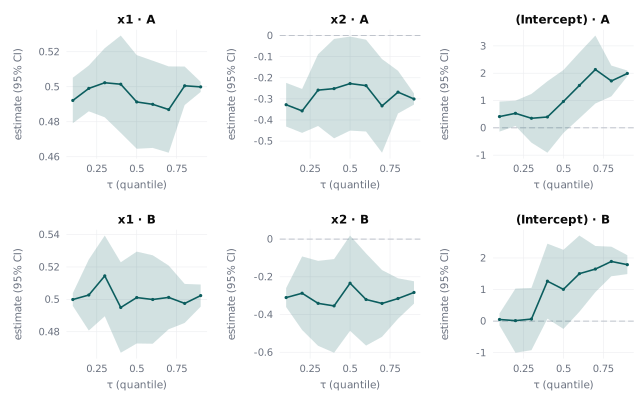
Quantile process
Section titled “Quantile process”A coefficient across quantiles τ with its band, one panel per term and group.
anofox_plot_terms · quantile_process_by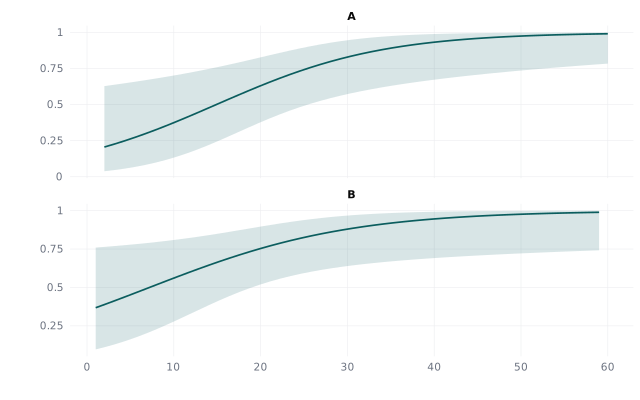
Effects on the probability
Section titled “Effects on the probability”P(y = 1) along a focal variable with its interval, one panel per group.
anofox_plot_prediction · logistic_effects_by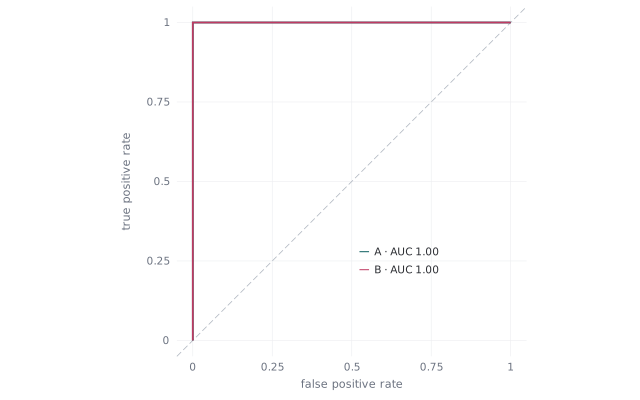
ROC curves
Section titled “ROC curves”True against false positive rate with the AUC in the legend.
anofox_plot_curve · roc_curve_by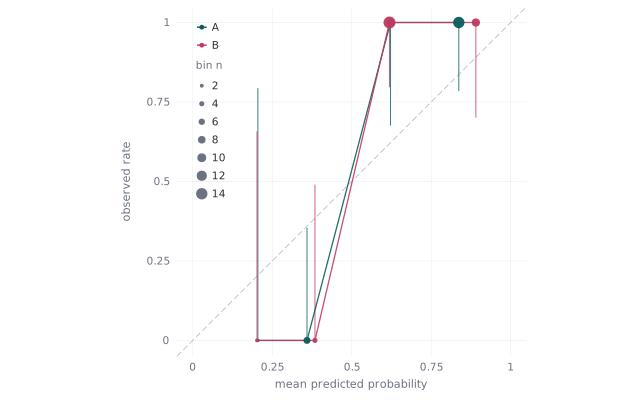
Calibration
Section titled “Calibration”Observed rate against predicted probability, dots sized by the bin count.
anofox_plot_curve · calibration_curve_by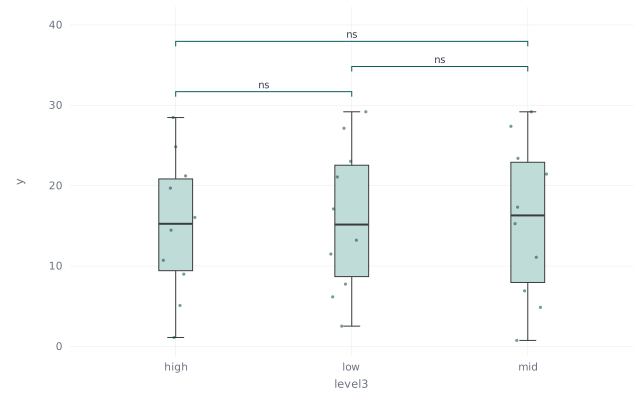
Groups with significance brackets
Section titled “Groups with significance brackets”Box plots per group with brackets from a post-hoc test.
anofox_plot_compare · tukey_hsd_agg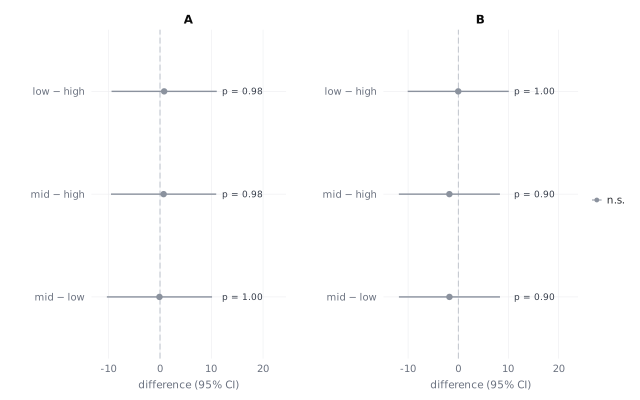
Pairwise comparisons
Section titled “Pairwise comparisons”Differences with 95 % intervals and p-values, one panel per group.
anofox_plot_tests · tukey_hsd_by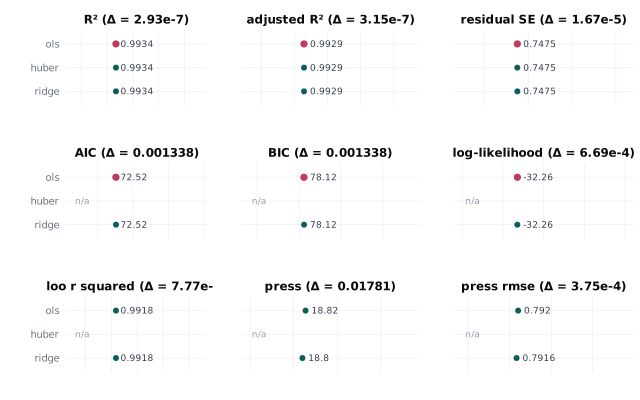
Model metrics side by side
Section titled “Model metrics side by side”One small panel per metric, the models in one order, the best highlighted.
anofox_plot_summary · *_glance_by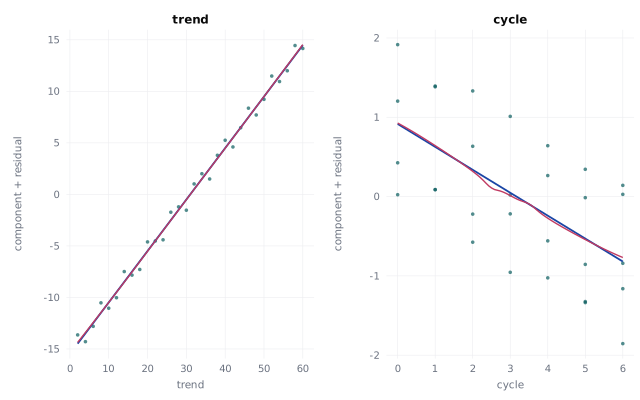
Component + residual
Section titled “Component + residual”A partial-residual plot per term with its component line and a smoother.
anofox_plot_partial · ols_partial_residuals_by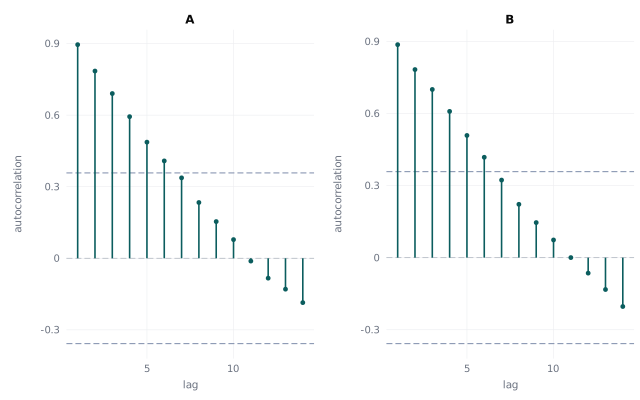
Autocorrelation
Section titled “Autocorrelation”ACF lollipops with significance bounds, one panel per series.
anofox_plot_curve · acf_by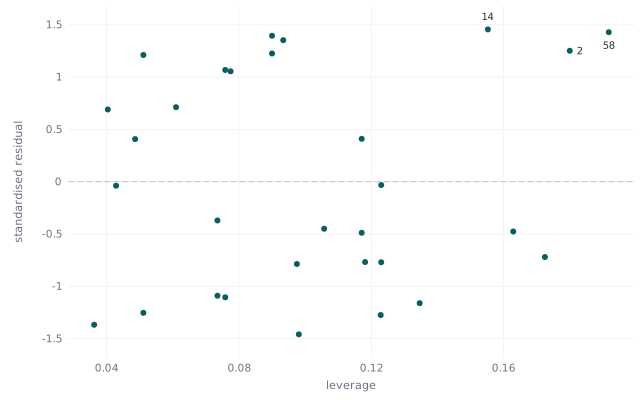
Leverage and outliers
Section titled “Leverage and outliers”Standardised residuals against leverage, the most influential rows labelled.
anofox_plot_obs · ols_augment_by