
What you can build
Every picture in this gallery is drawn by anofox-visualization from the SQL shown beside it, on made-up sample data. Open any of them in the builder and change it.
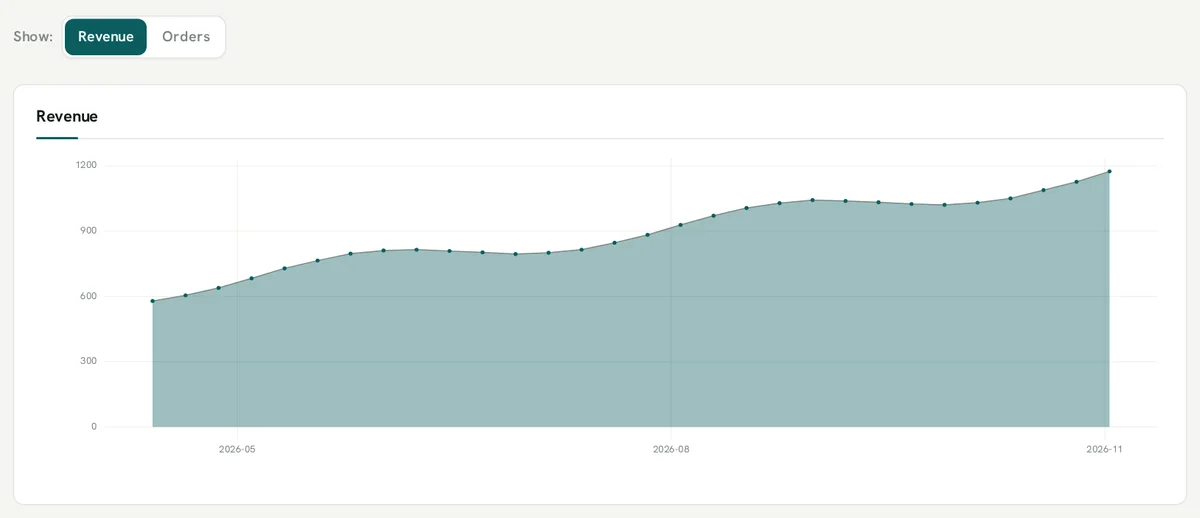
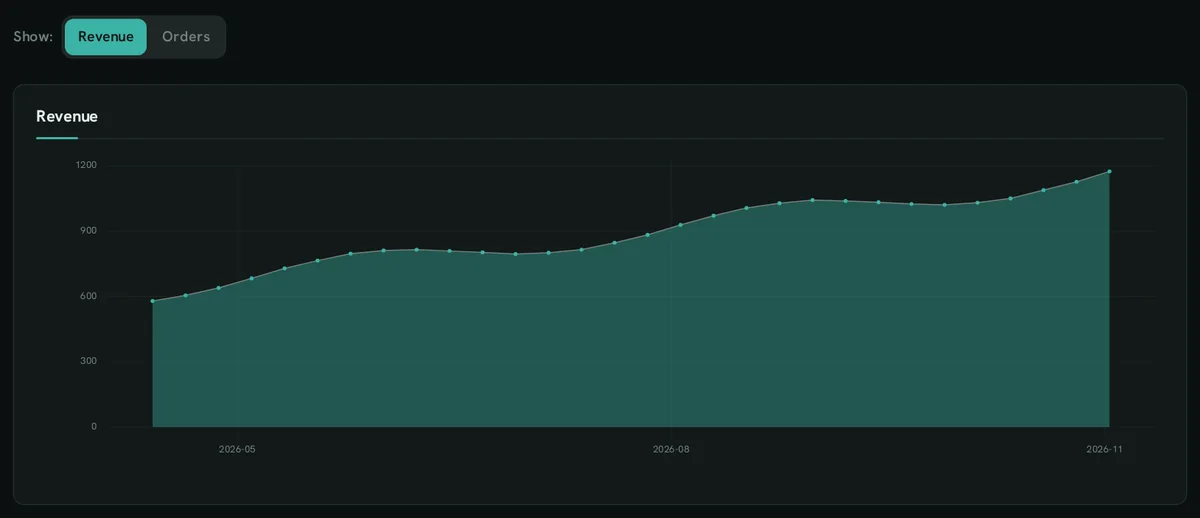 Inputs and filtersDropdowns, multi-selects, buttons, toggles, dates, periods, search.

 KPIsChange, trend, goal, status colours, strips, gauges and bullets.
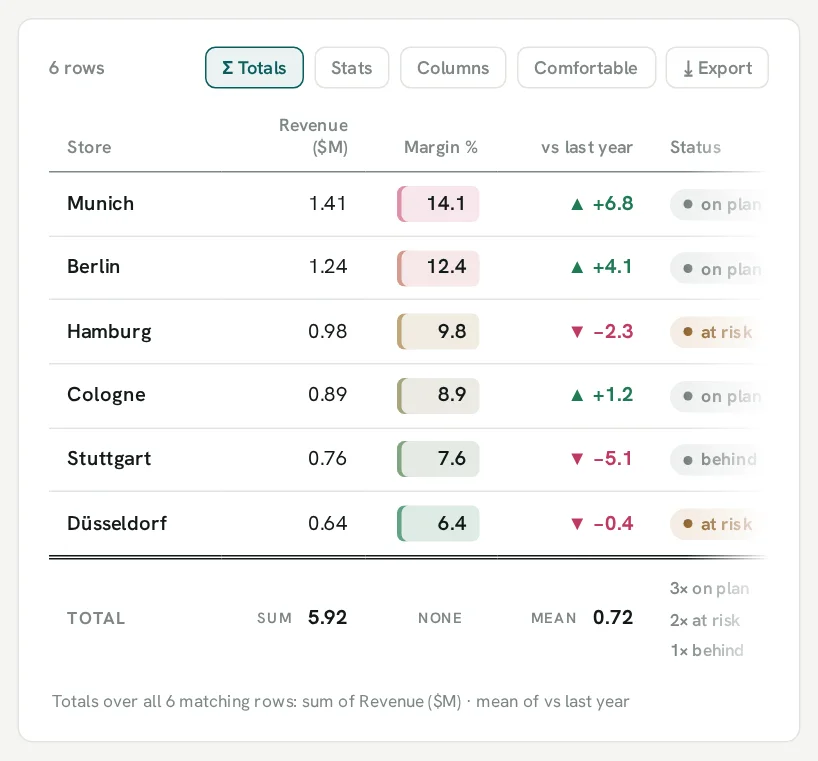
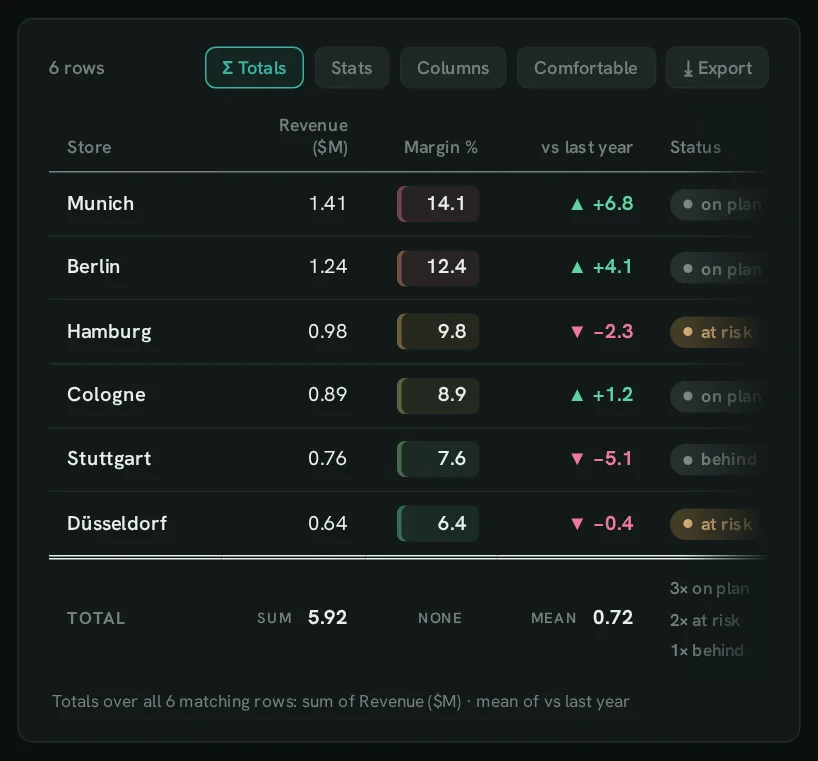 TablesFormats, sparklines, subtotals, grouped headers, flags, selection, links.
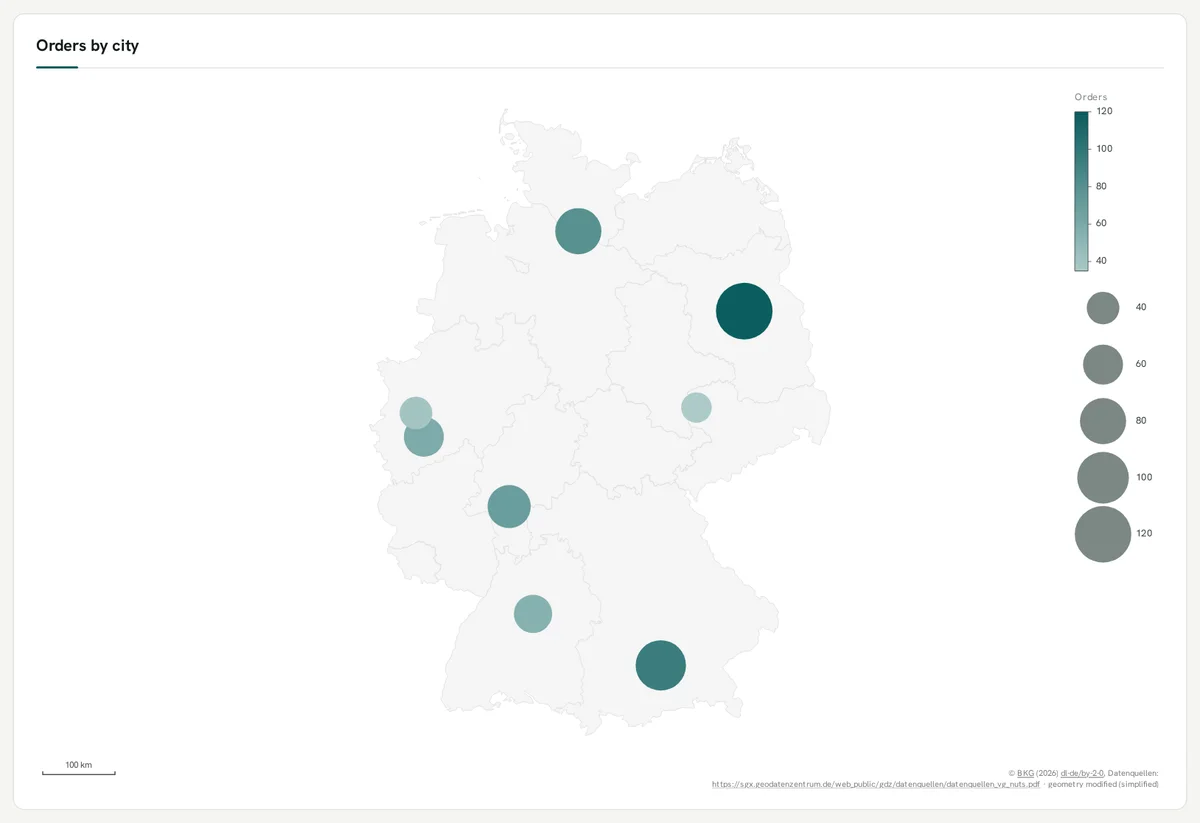
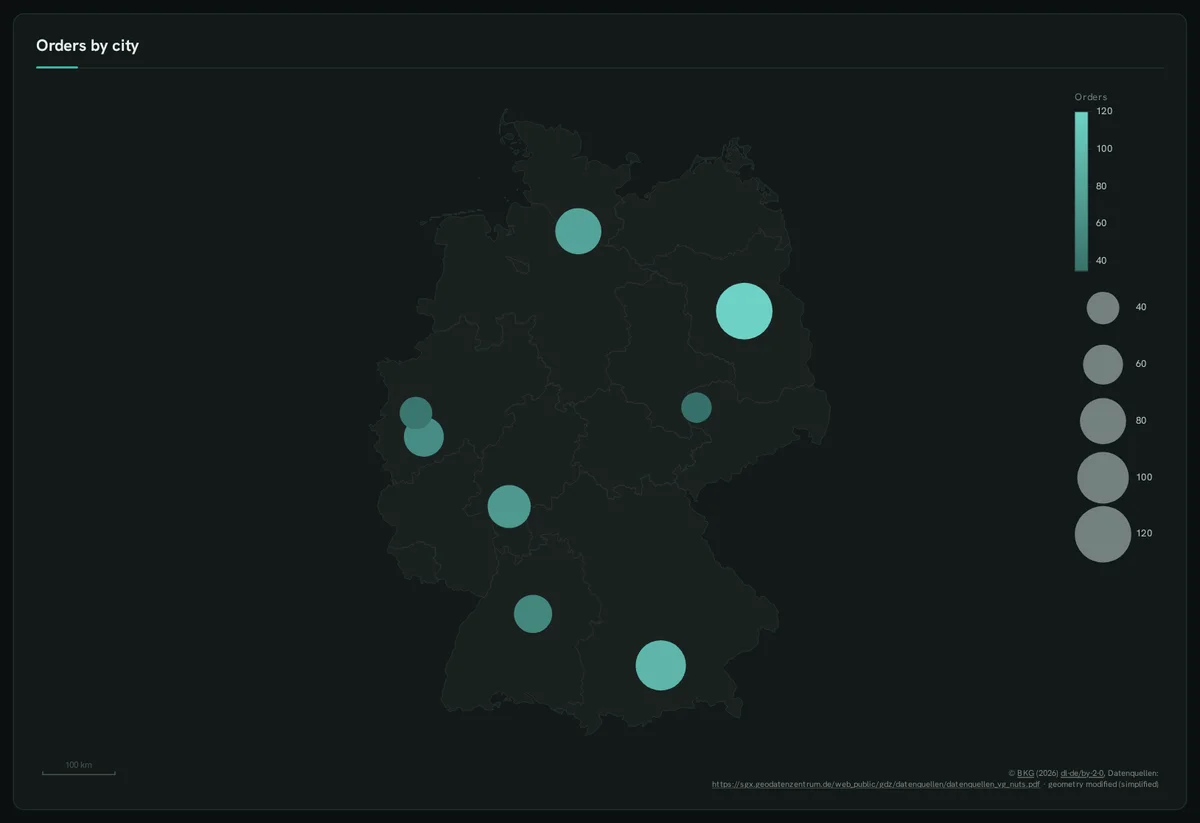 MapsRegions by code, points, flows, two measures, small multiples, drill-down.
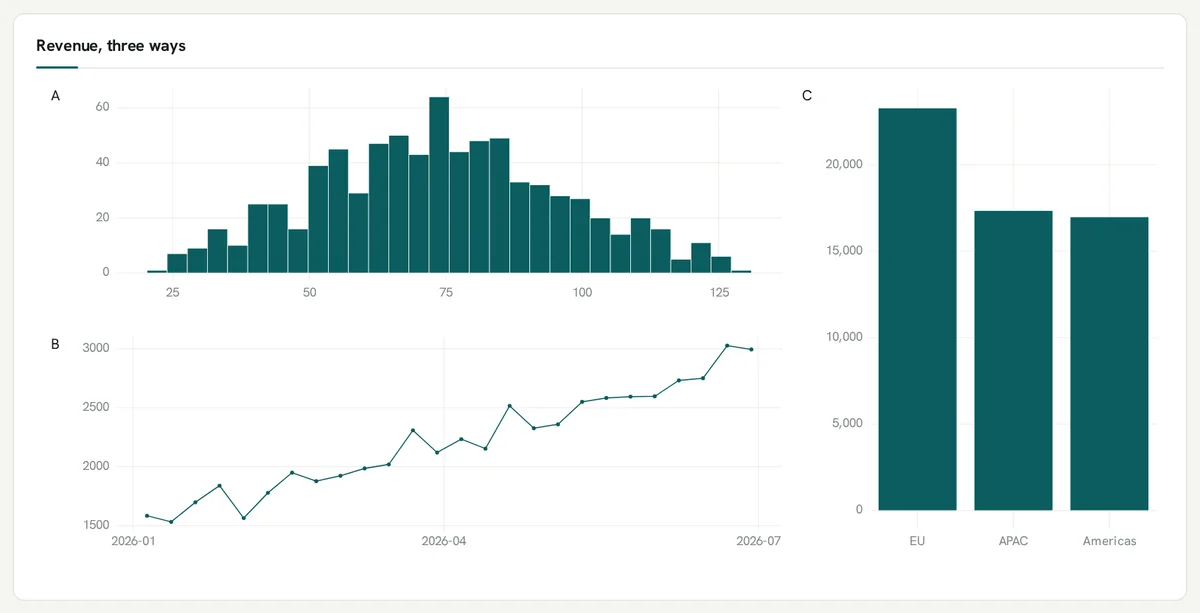
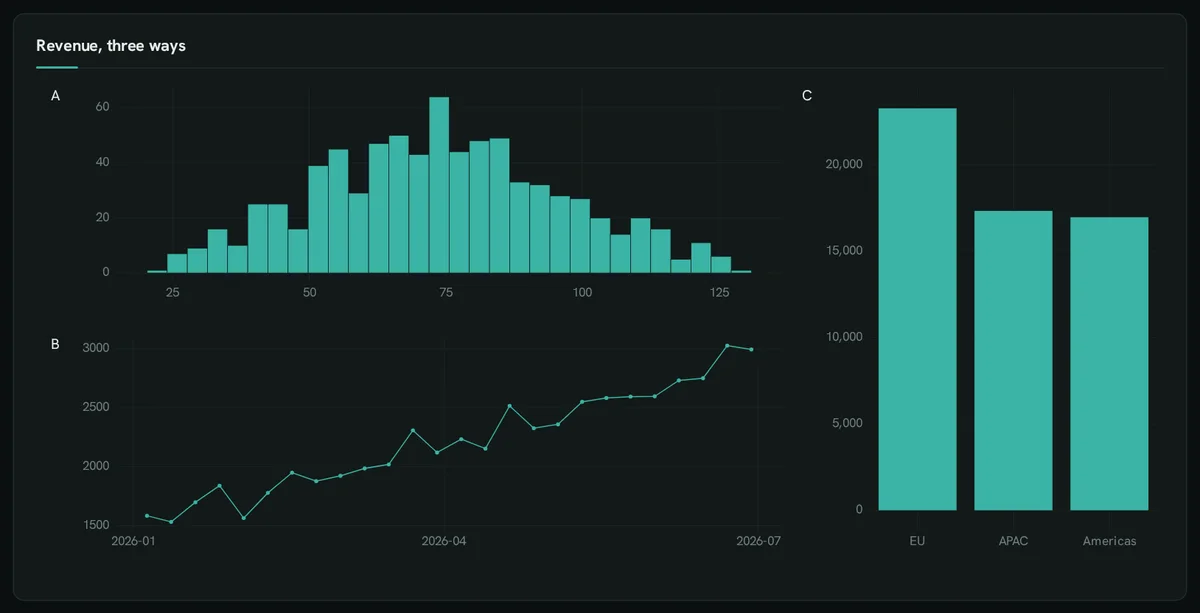 Interactions and featuresDrill-down, selections, views, figures, annotations, guided steps, diagrams, factor graphs.
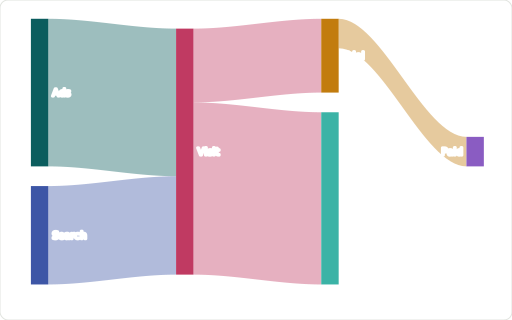
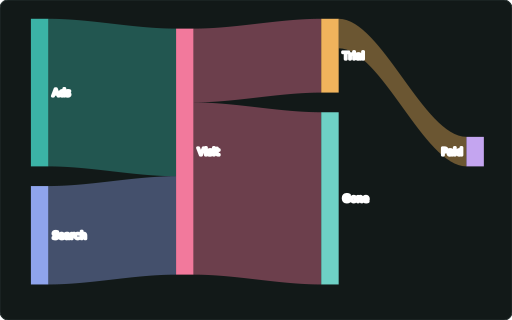 42 chart kindsOne page each, with the data it needs.
What each anofox extension draws
Section titled “What each anofox extension draws”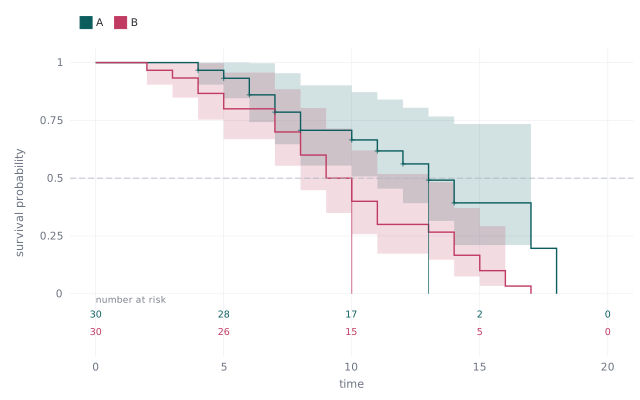 anofox-statisticsCoefficients, diagnostics, survival, ROC and calibration, tests.
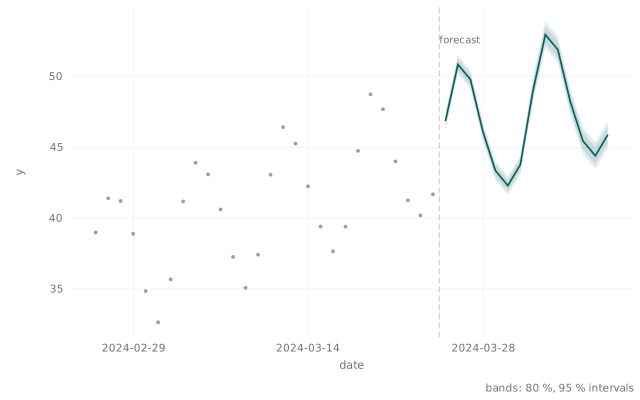 anofox-forecastForecast fans, backtests, decompositions, folds, metrics.
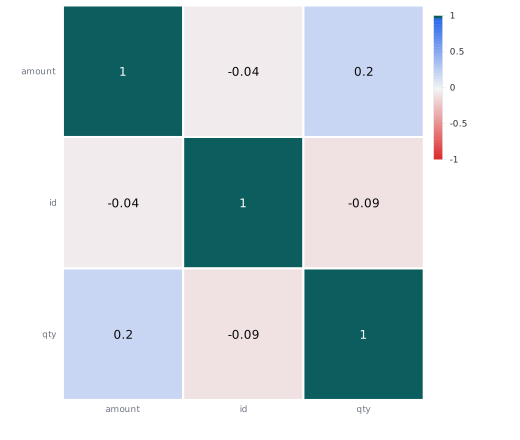 anofox-tabularQuality checks, profiles, correlations, anomalies, PII.
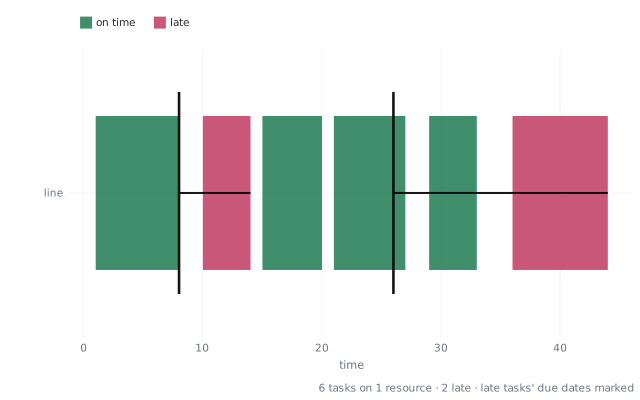 anofox-optimizePacking, waves, schedules, routes, selections.
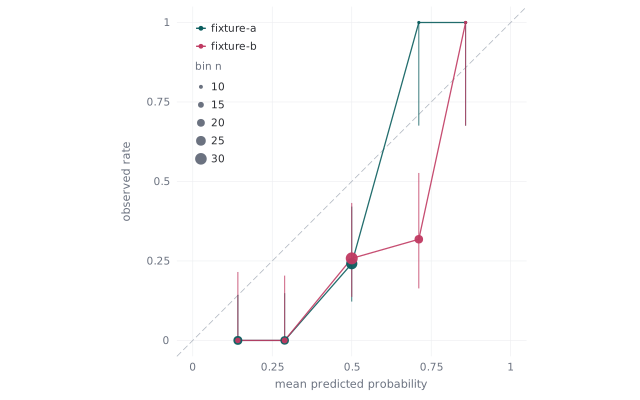 anofox-decideROC, calibration, precision and recall, choice distributions.