
Maps
Built-in boundaries (countries, states and provinces, German districts, NUTS), points by latitude and longitude, flows, and any WKT geometry — with classes, legends that avoid the data, and drill-down.
The sample data every tile on this page uses
CREATE TABLE states AS SELECT * FROM (VALUES ('DE-BW','Baden-Württemberg',51,2.1),('DE-BY','Bavaria',63,2.4),('DE-BE','Berlin',22,3.0),('DE-BB','Brandenburg',9,1.2), ('DE-HB','Bremen',4,1.9),('DE-HH','Hamburg',13,2.8),('DE-HE','Hesse',31,2.2),('DE-MV','Mecklenburg-Vorpommern',6,0.9), ('DE-NI','Lower Saxony',30,1.6),('DE-NW','North Rhine-Westphalia',72,1.8),('DE-RP','Rhineland-Palatinate',16,1.4), ('DE-SL','Saarland',3,1.1),('DE-SN','Saxony',15,1.5),('DE-ST','Saxony-Anhalt',6,0.8),('DE-SH','Schleswig-Holstein',12,1.3), ('DE-TH','Thuringia',7,1.0)) t(code, name, revenue, growth);SELECT 1::COLUMNS;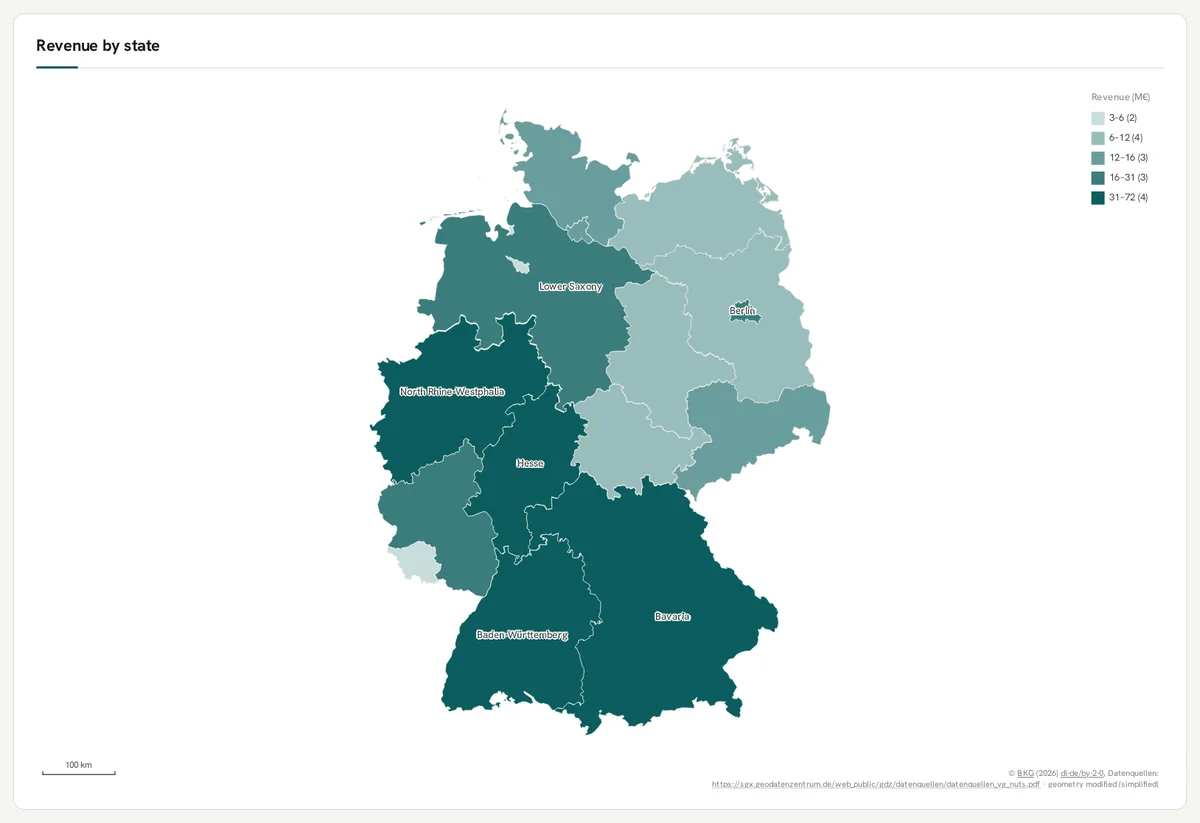
A choropleth by region code
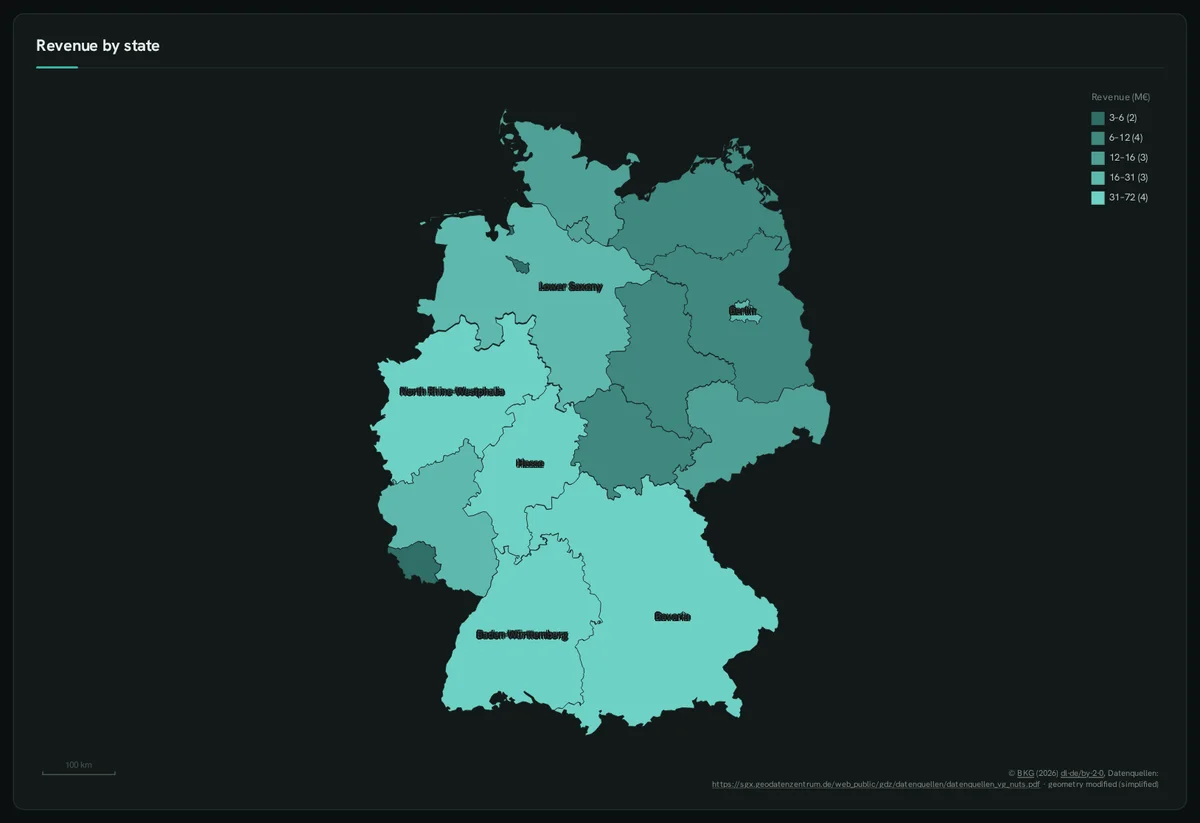
Section titled “A choropleth by region code”::REGION takes ISO, state, district or NUTS codes — the shapes are built in. ::CLASSES makes a stepped legend.
SELECT code ::REGION, name ::LABEL, revenue AS "Revenue (M€)" ::BARCHART, 'quantile 5'::CLASSES, 6::LABEL_TOP, 'Revenue by state'::TITLE FROM states;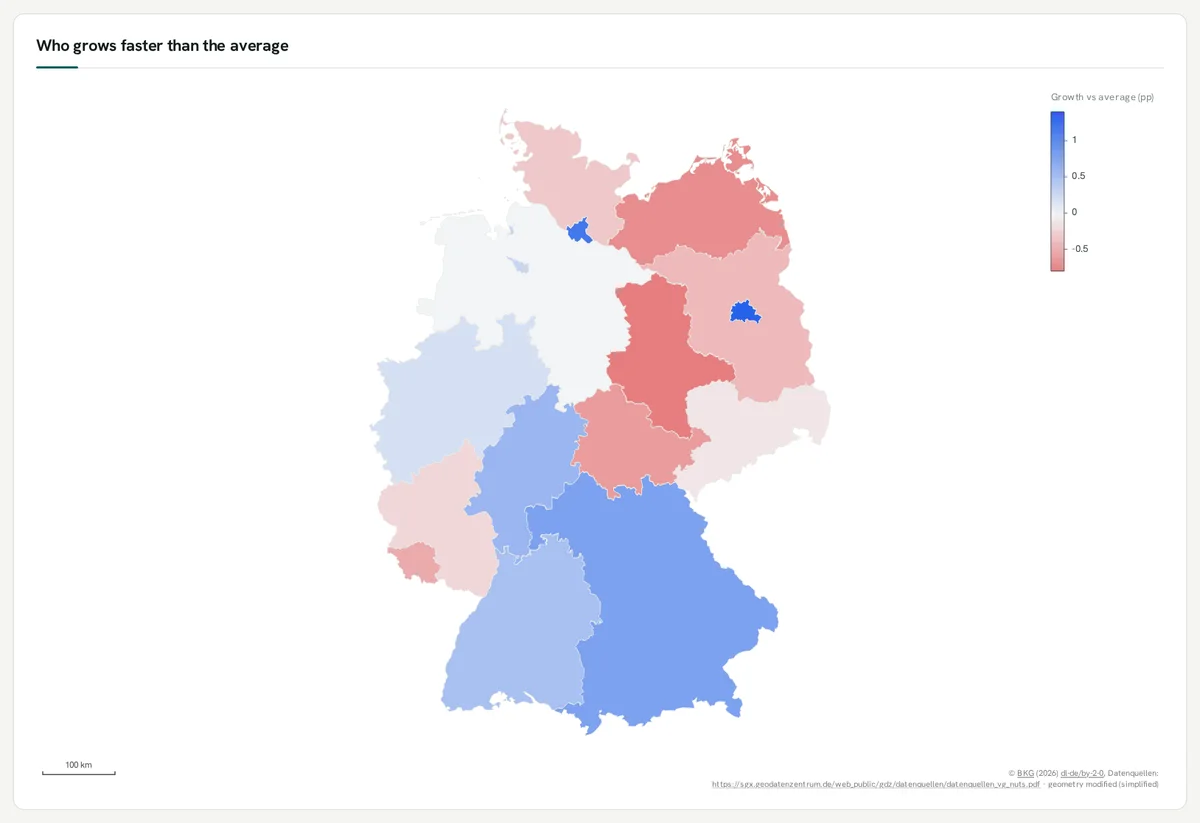
Diverging colours
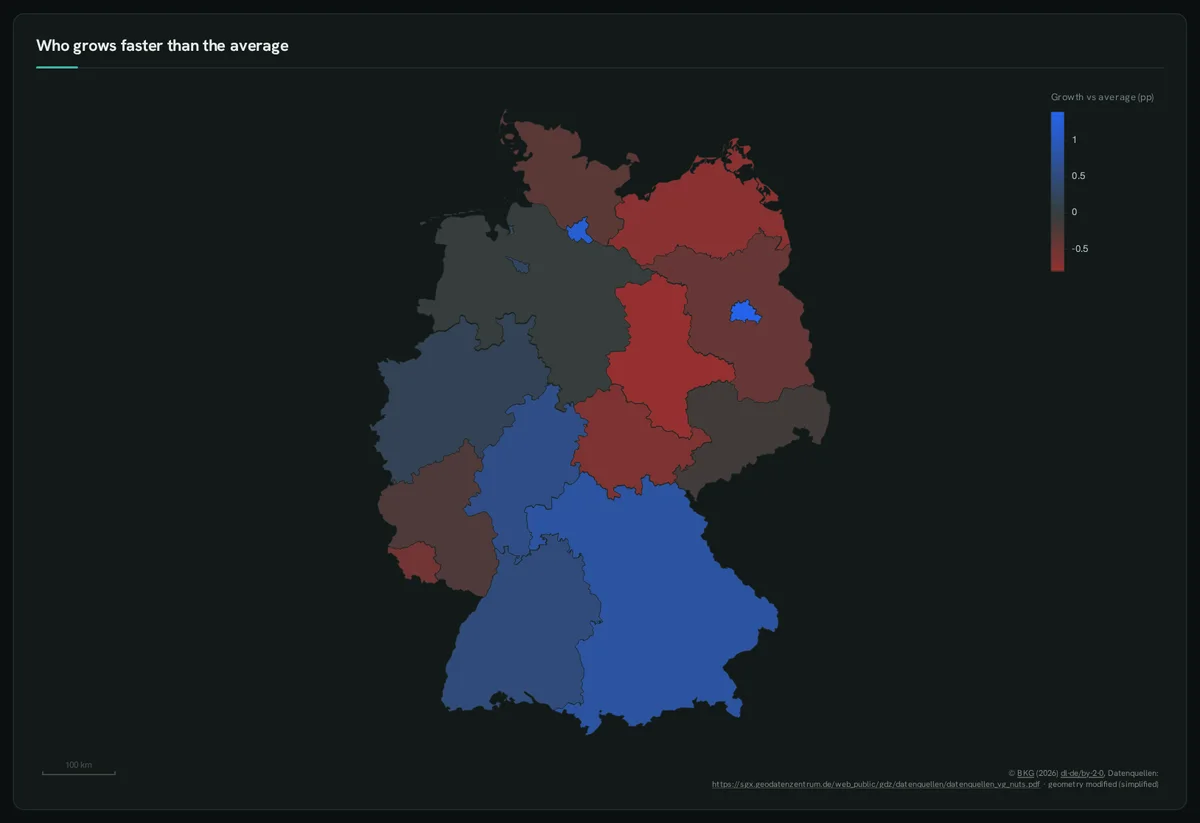
Section titled “Diverging colours”Values around a midpoint get the theme’s diverging ramp.
SELECT code ::REGION, name ::LABEL, round(growth - 1.6, 2) AS "Growth vs average (pp)" ::BARCHART, 'Who grows faster than the average'::TITLE FROM states;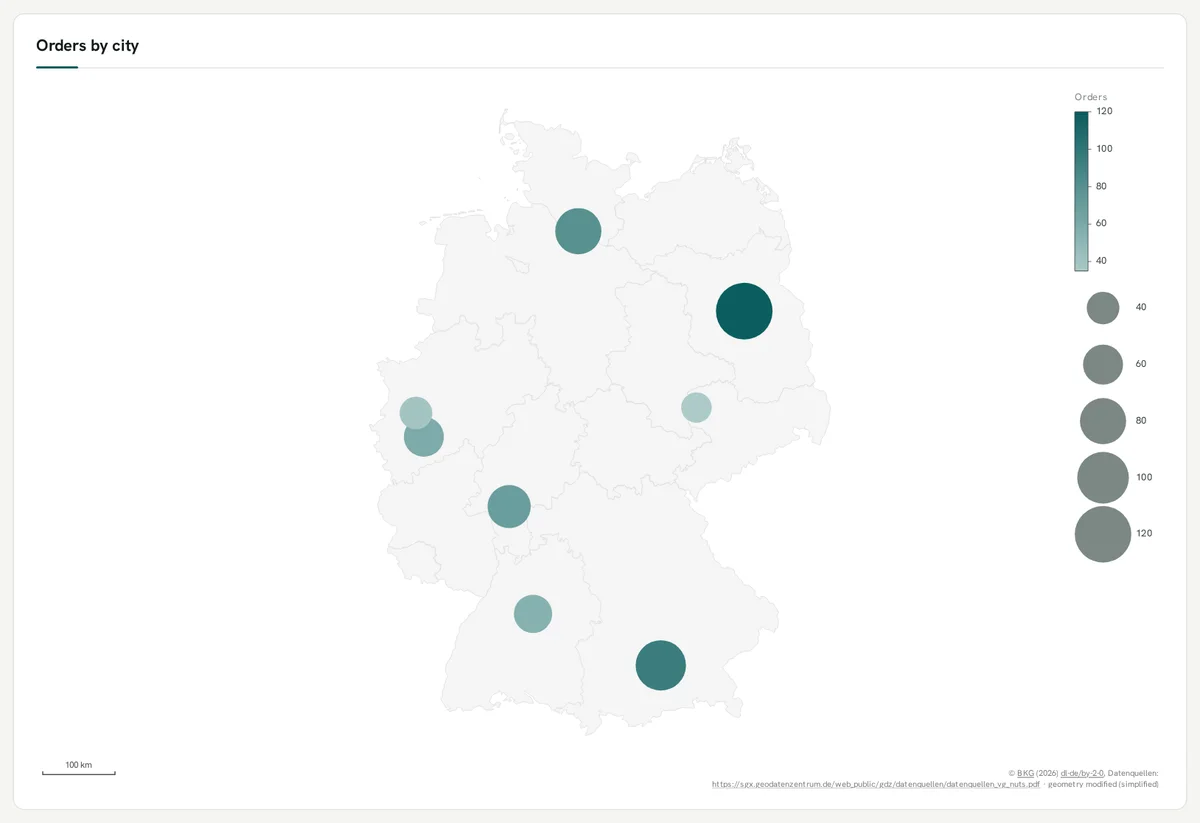
Points over a backdrop
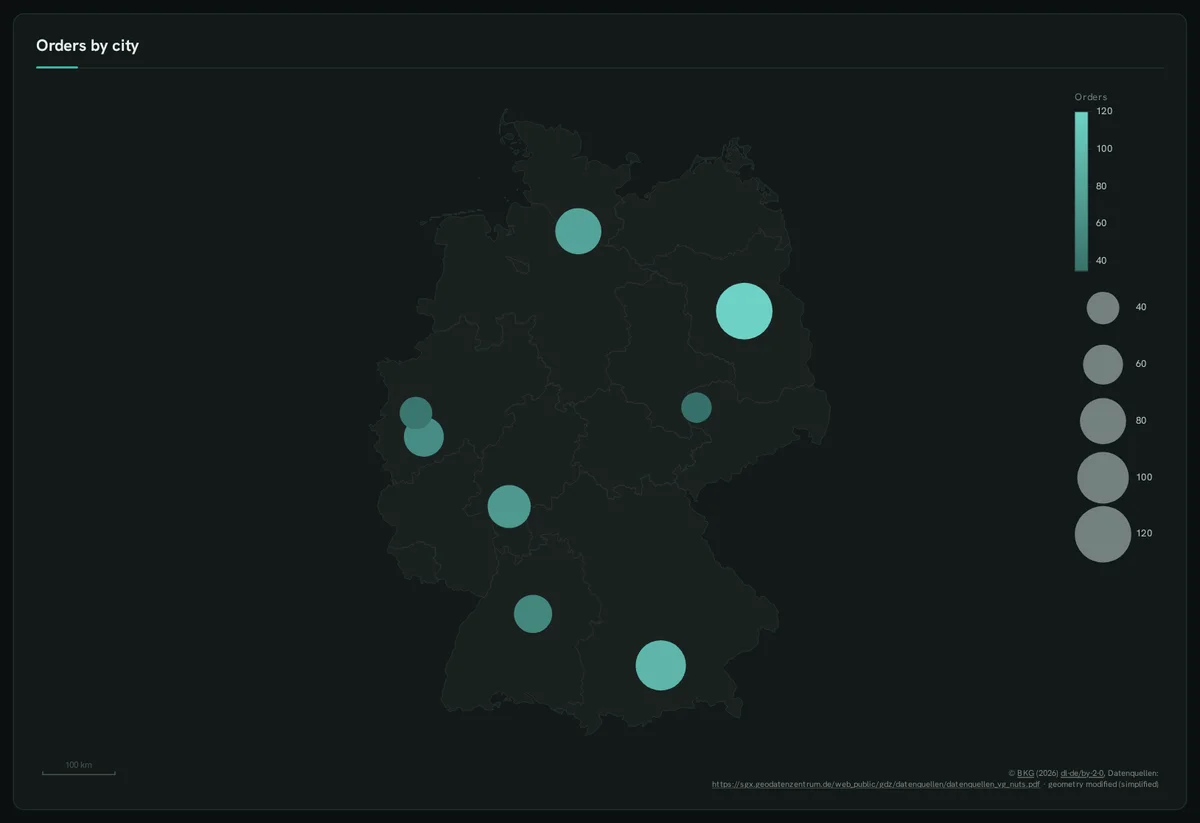
Section titled “Points over a backdrop”::LAT / ::LON per row; a measure sizes or colours the points; ::BASEMAP draws the states underneath.
SELECT lat ::LAT, lon ::LON, city ::LABEL, orders ::SIZE, orders AS "Orders" ::BARCHART, 'de-states' ::BASEMAP, 'Orders by city'::TITLEFROM (VALUES (52.52,13.40,'Berlin',120),(53.55,9.99,'Hamburg',80),(48.14,11.58,'Munich',95),(50.94,6.96,'Cologne',60), (50.11,8.68,'Frankfurt',70),(48.78,9.18,'Stuttgart',55),(51.34,12.37,'Leipzig',35),(51.23,6.78,'Düsseldorf',40)) t(lat, lon, city, orders);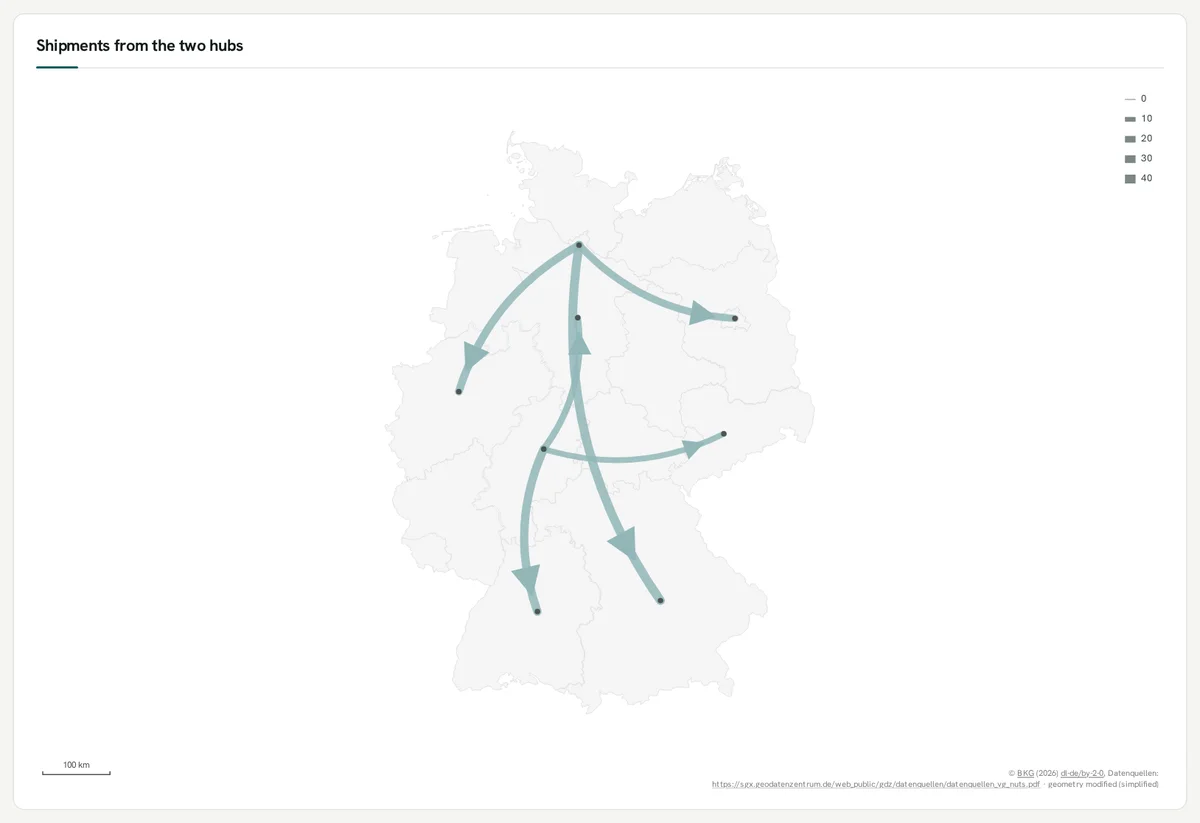
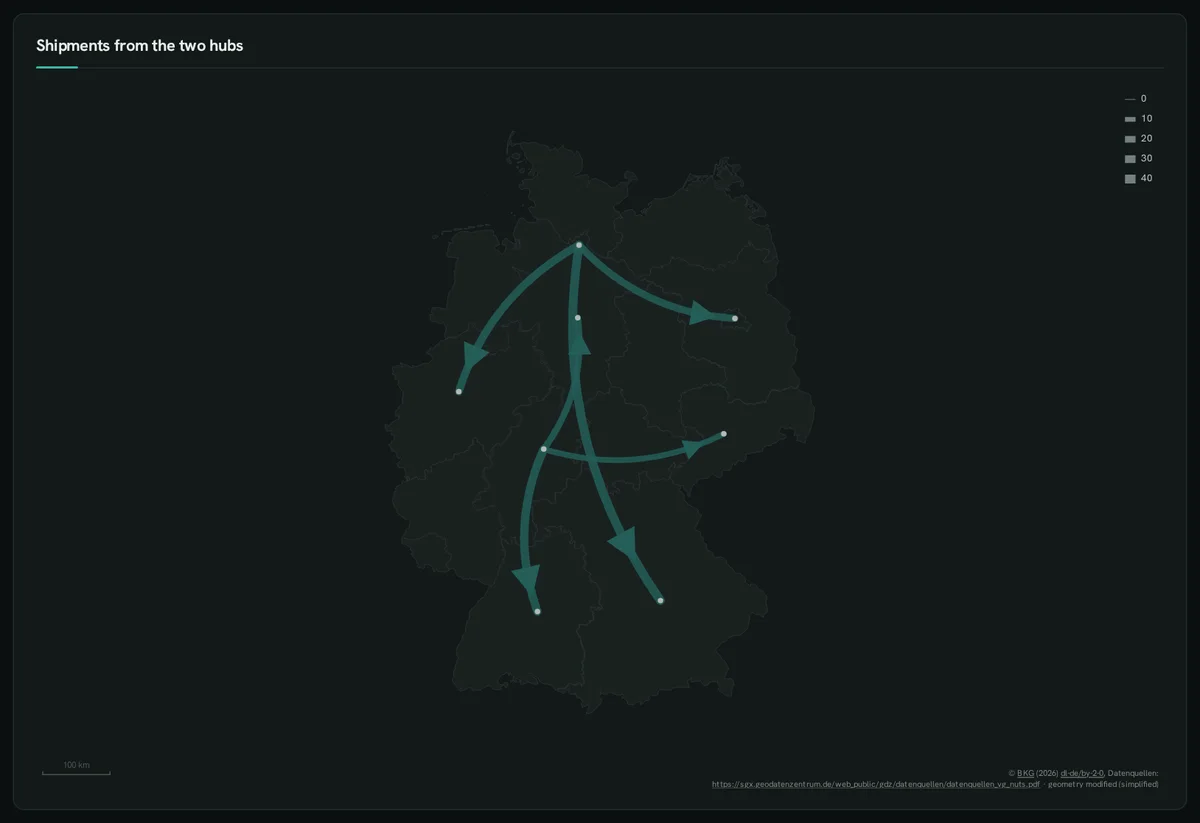
::ORIGIN → ::DEST, width by ::SIZE — between region codes or points.
SELECT a ::ORIGIN, b ::DEST, n ::SIZE, 'de-states' ::BASEMAP, 'Shipments from the two hubs'::TITLEFROM (VALUES ('DE-HH','DE-BY',40),('DE-HH','DE-BE',25),('DE-HH','DE-NW',30),('DE-HE','DE-BW',35),('DE-HE','DE-SN',15),('DE-HE','DE-NI',20)) t(a, b, n);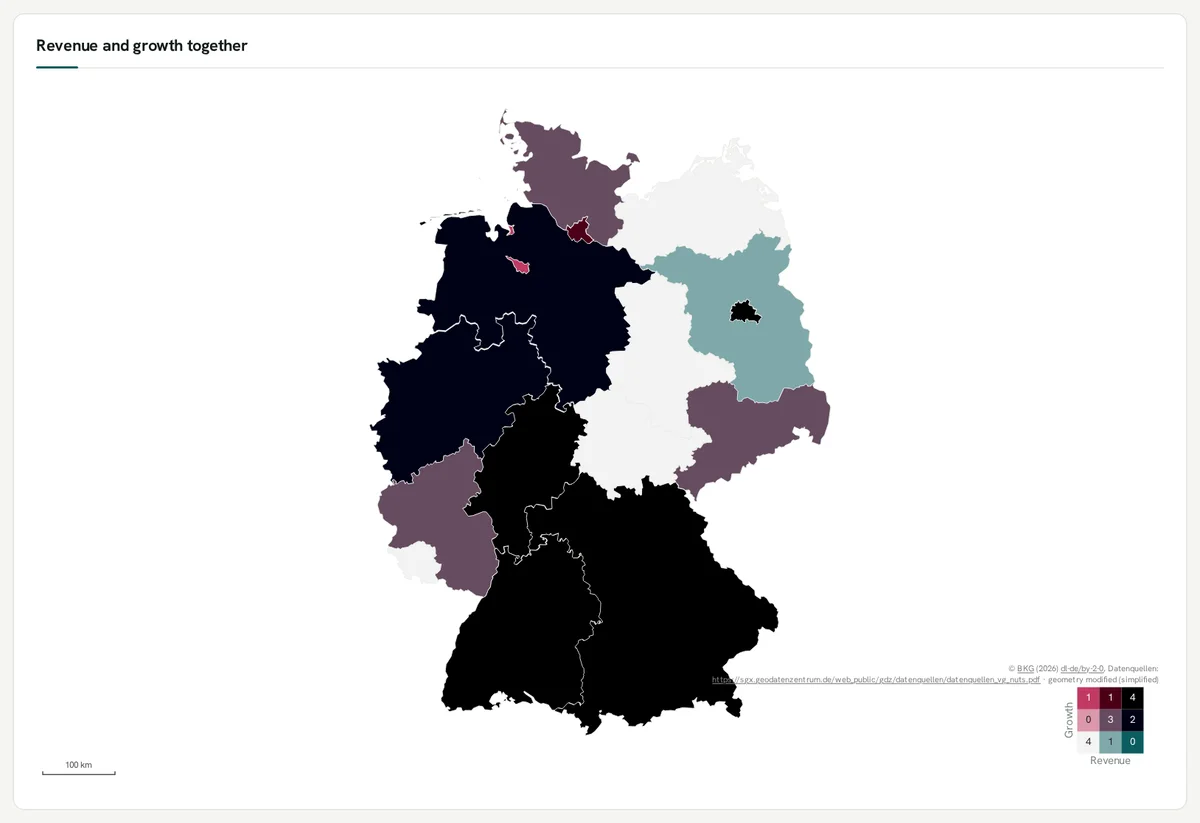
Two measures at once
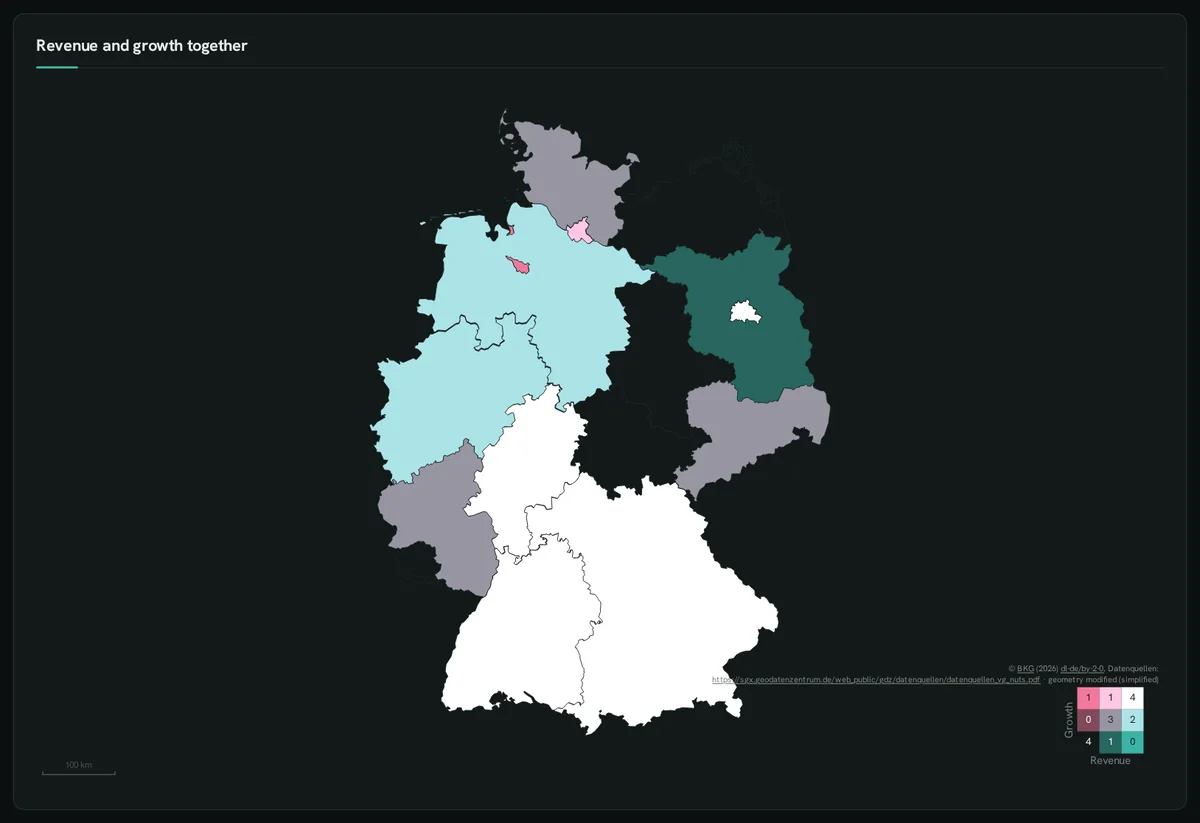
Section titled “Two measures at once”::BIVARIATE colours each region by tertiles of two measures, with a 3 × 3 legend.
SELECT code ::REGION, name ::LABEL, revenue AS "Revenue" ::BARCHART, growth AS "Growth" ::BIVARIATE, 'Revenue and growth together'::TITLE FROM states;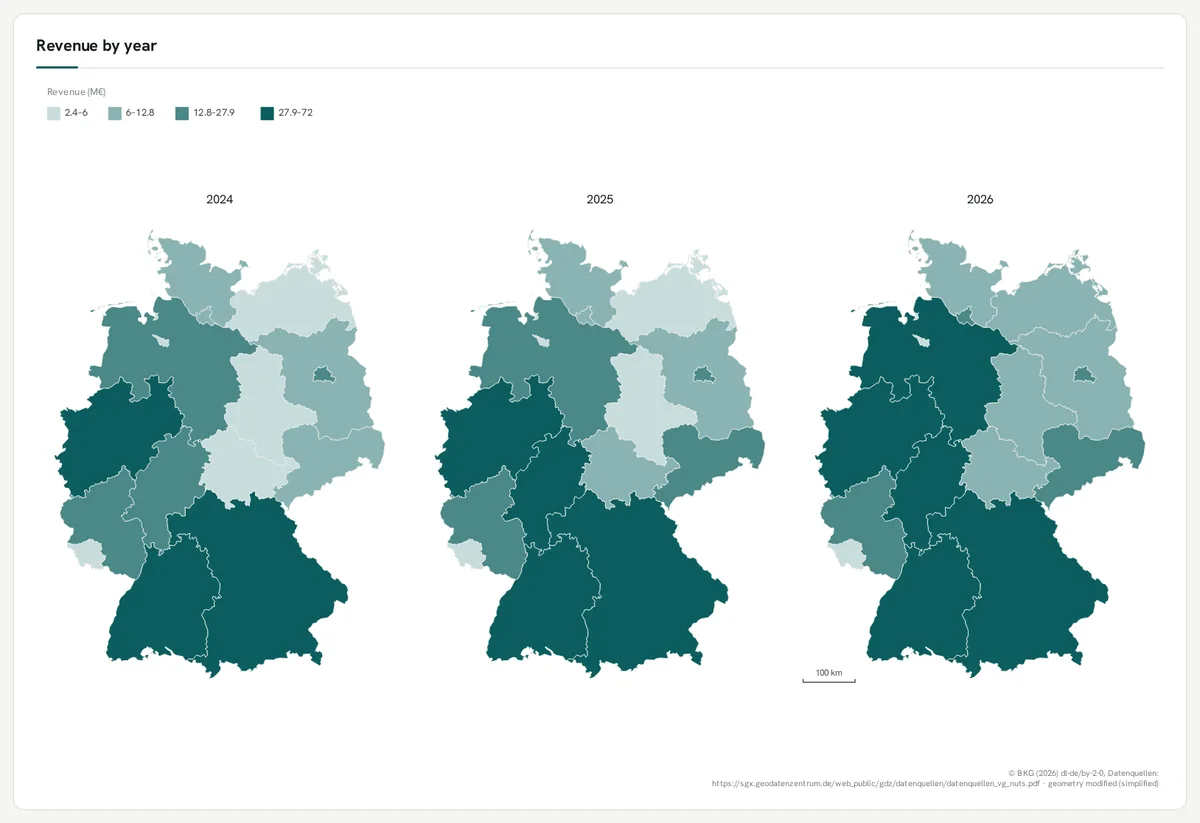
One map per value
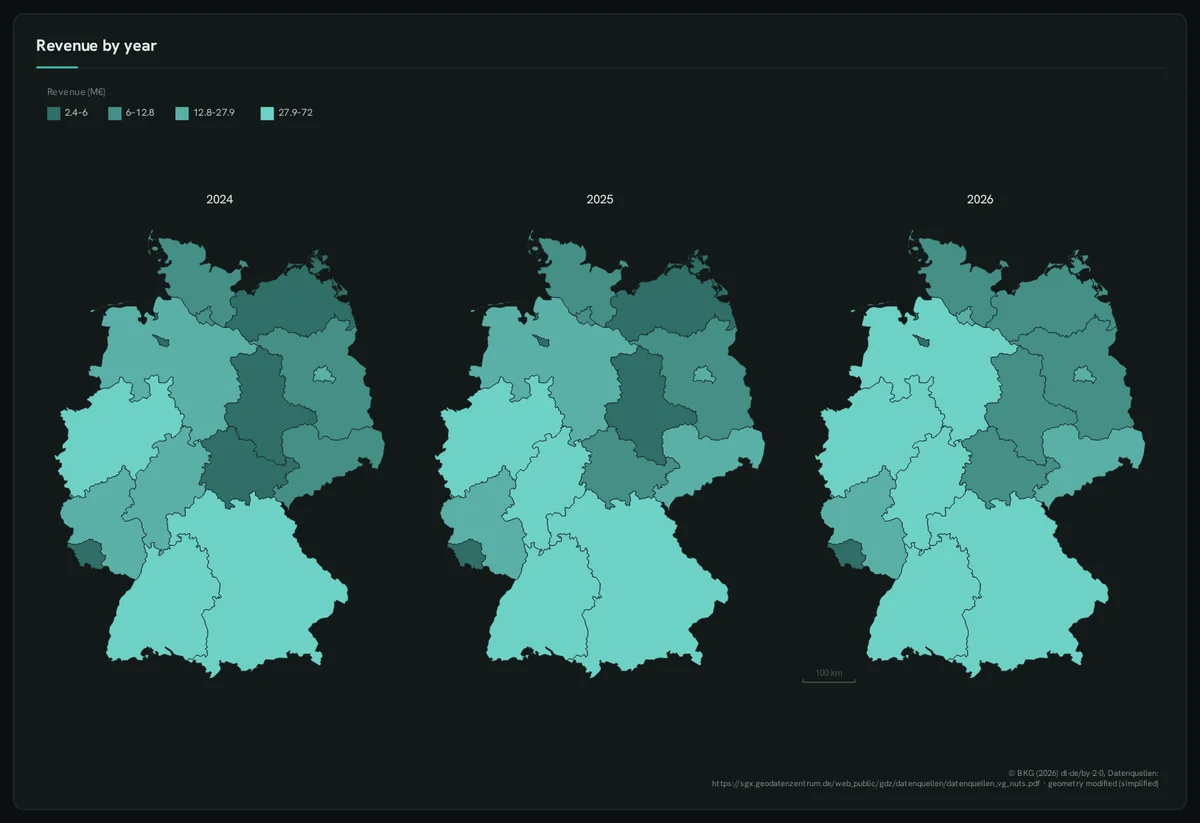
Section titled “One map per value”::FACET on a map: shared projection, extent and one legend.
SELECT code ::REGION, revenue * f AS "Revenue (M€)" ::BARCHART, y ::FACET, 'quantile 4'::CLASSES, 'Revenue by year'::TITLEFROM states, (VALUES ('2024', 0.8), ('2025', 0.9), ('2026', 1.0)) t(y, f);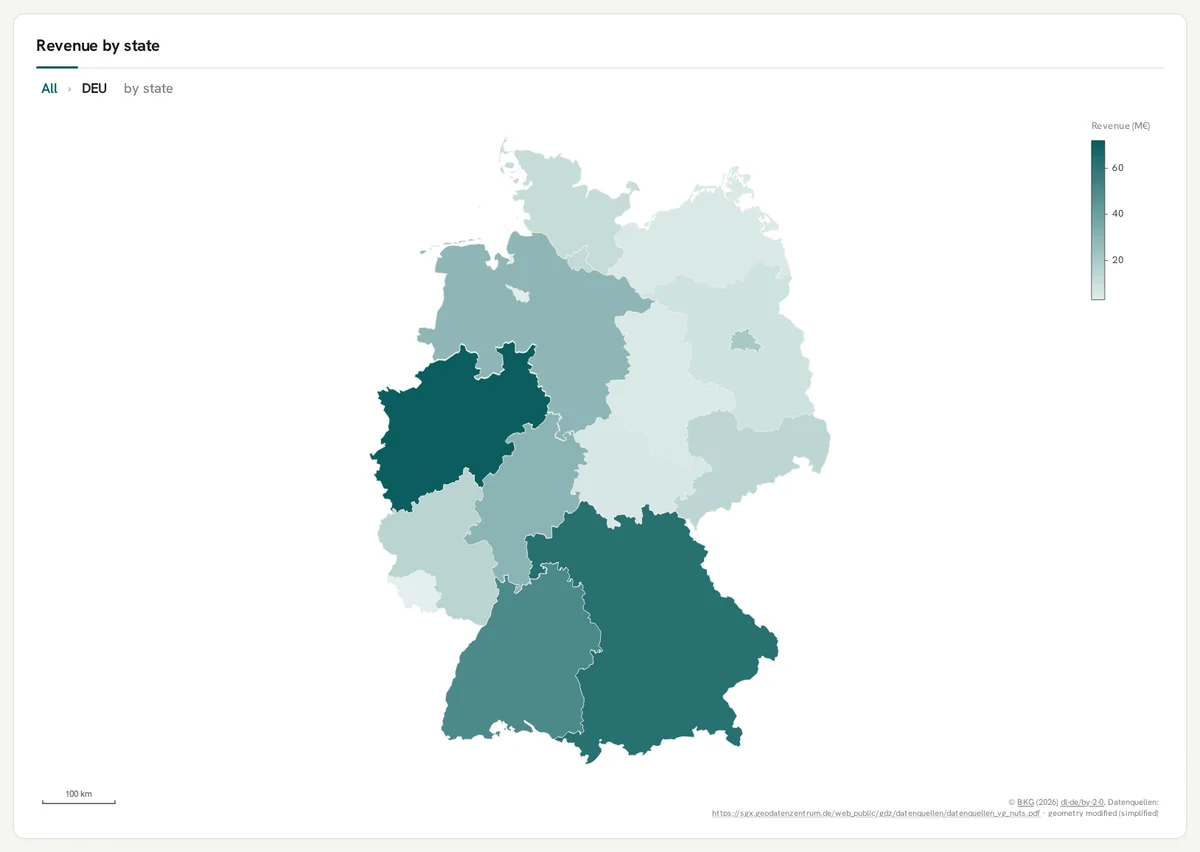
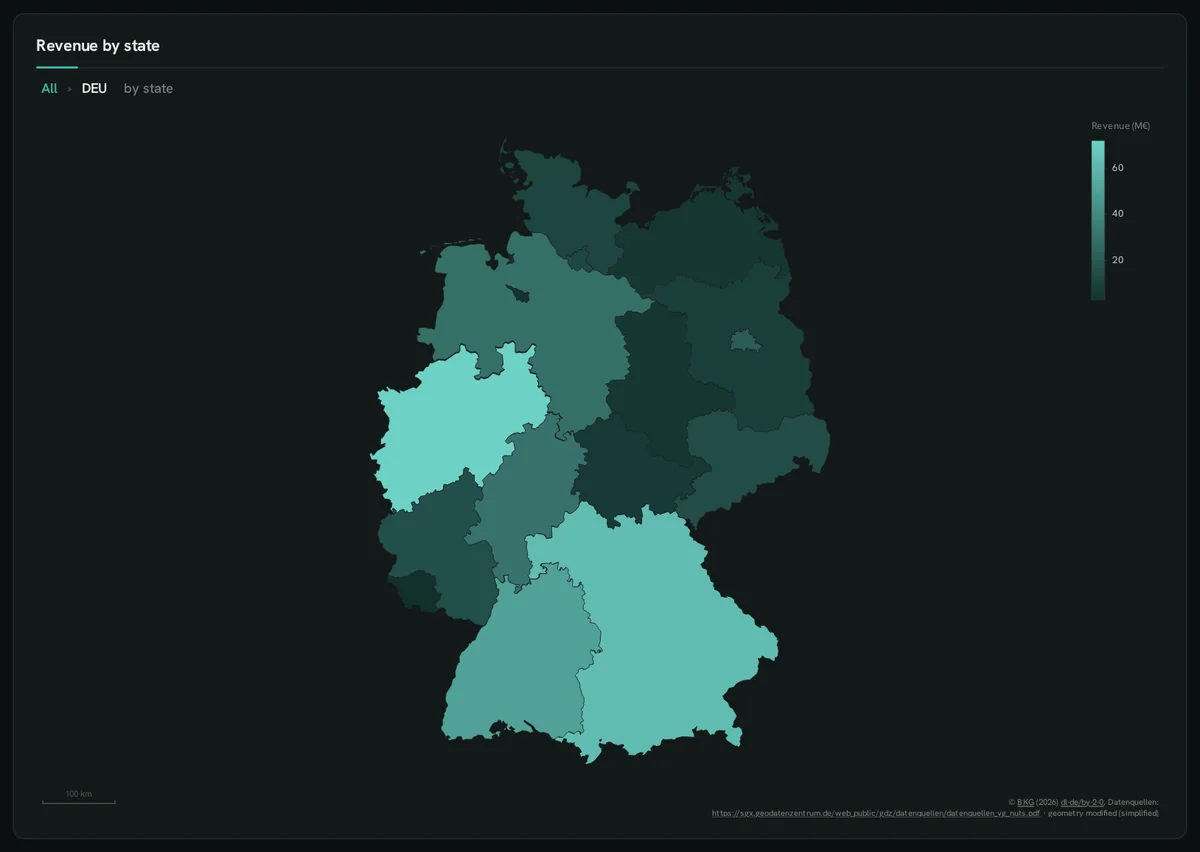
Drill from countries to states
Section titled “Drill from countries to states”'geo: country > state'::DRILL on a ::REGION map: a click on Germany shows its states.
SELECT 'geo: country > state'::DRILL;SELECT CASE getvariable('geo_level') WHEN 'state' THEN code ELSE c END ::REGION, CASE getvariable('geo_level') WHEN 'state' THEN name ELSE cn END ::LABEL, CASE getvariable('geo_level') WHEN 'state' THEN revenue ELSE v END AS "Revenue (M€)" ::BARCHART, ('Revenue by ' || coalesce(getvariable('geo_level'), 'country'))::TITLEFROM (SELECT * FROM (VALUES ('DEU','Germany',360),('FRA','France',240),('POL','Poland',110),('AUT','Austria',70),('CHE','Switzerland',90), ('NLD','Netherlands',85),('BEL','Belgium',60),('CZE','Czechia',45),('DNK','Denmark',40)) t(c, cn, v)) countriesLEFT JOIN states ON getvariable('geo_level') = 'state' AND countries.c = 'DEU'WHERE coalesce(getvariable('geo_level'), 'country') = 'country' OR (countries.c = 'DEU' AND states.code IS NOT NULL);