
Dashboards that are just SQL.
SELECT with a ::ROLE and it becomes a chart, a KPI, a table or an input. Maps, forecasts, drill-downs, guarded servers and agents come from the same SQL file — no JavaScript, no config.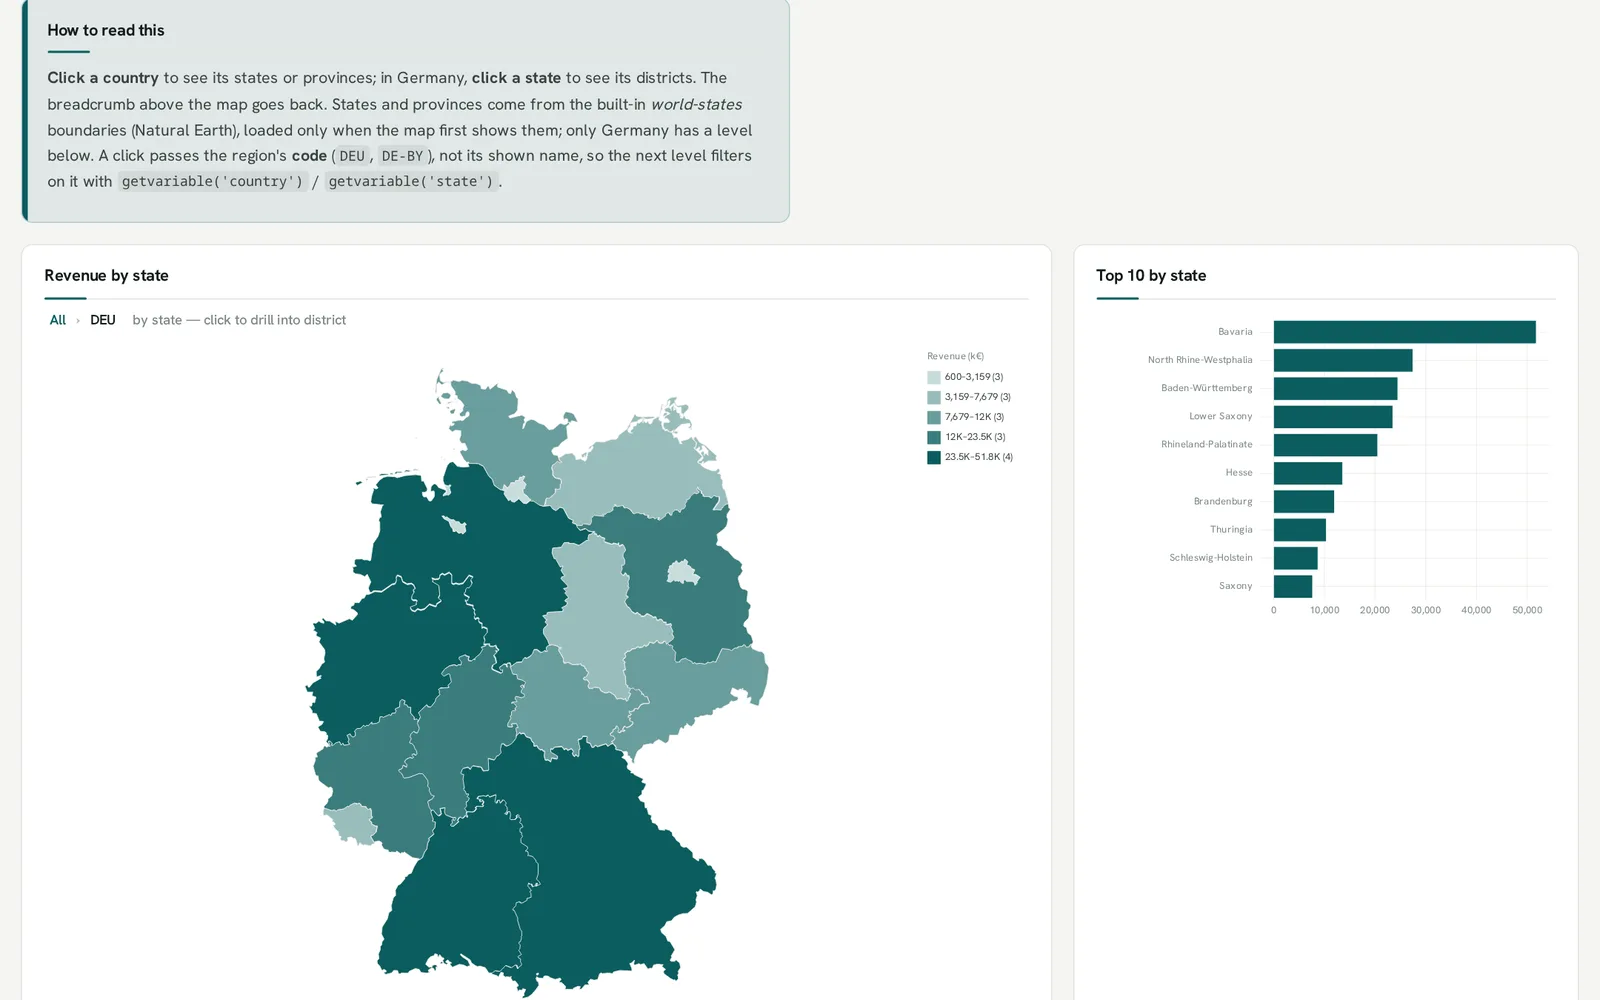
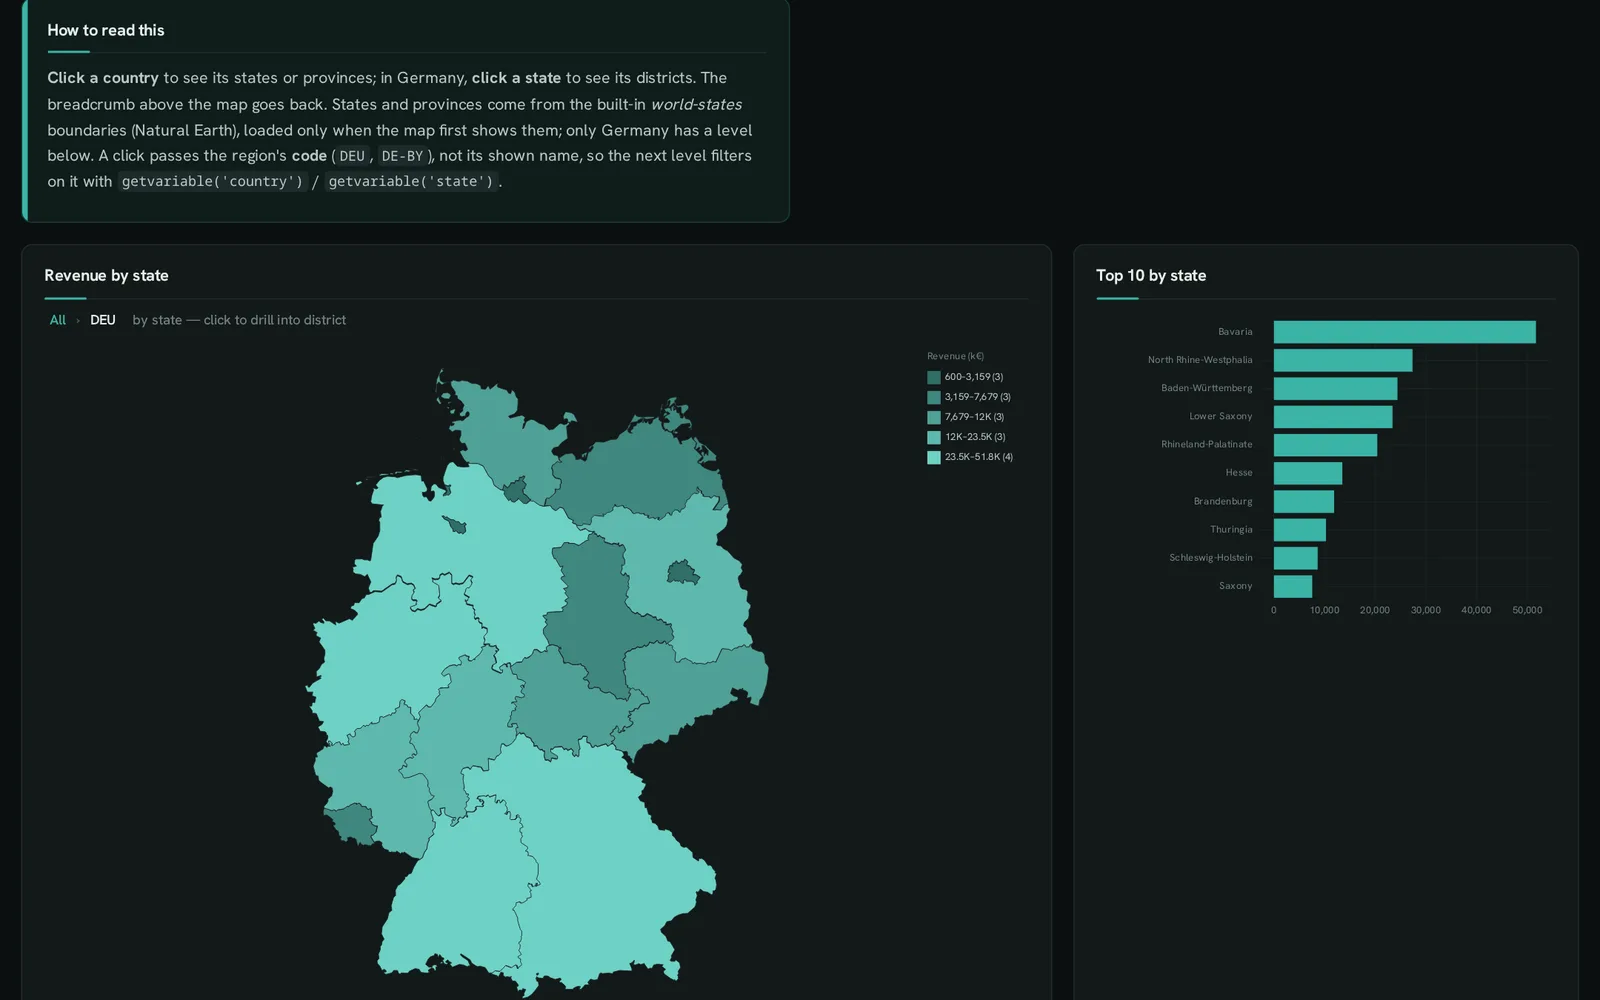
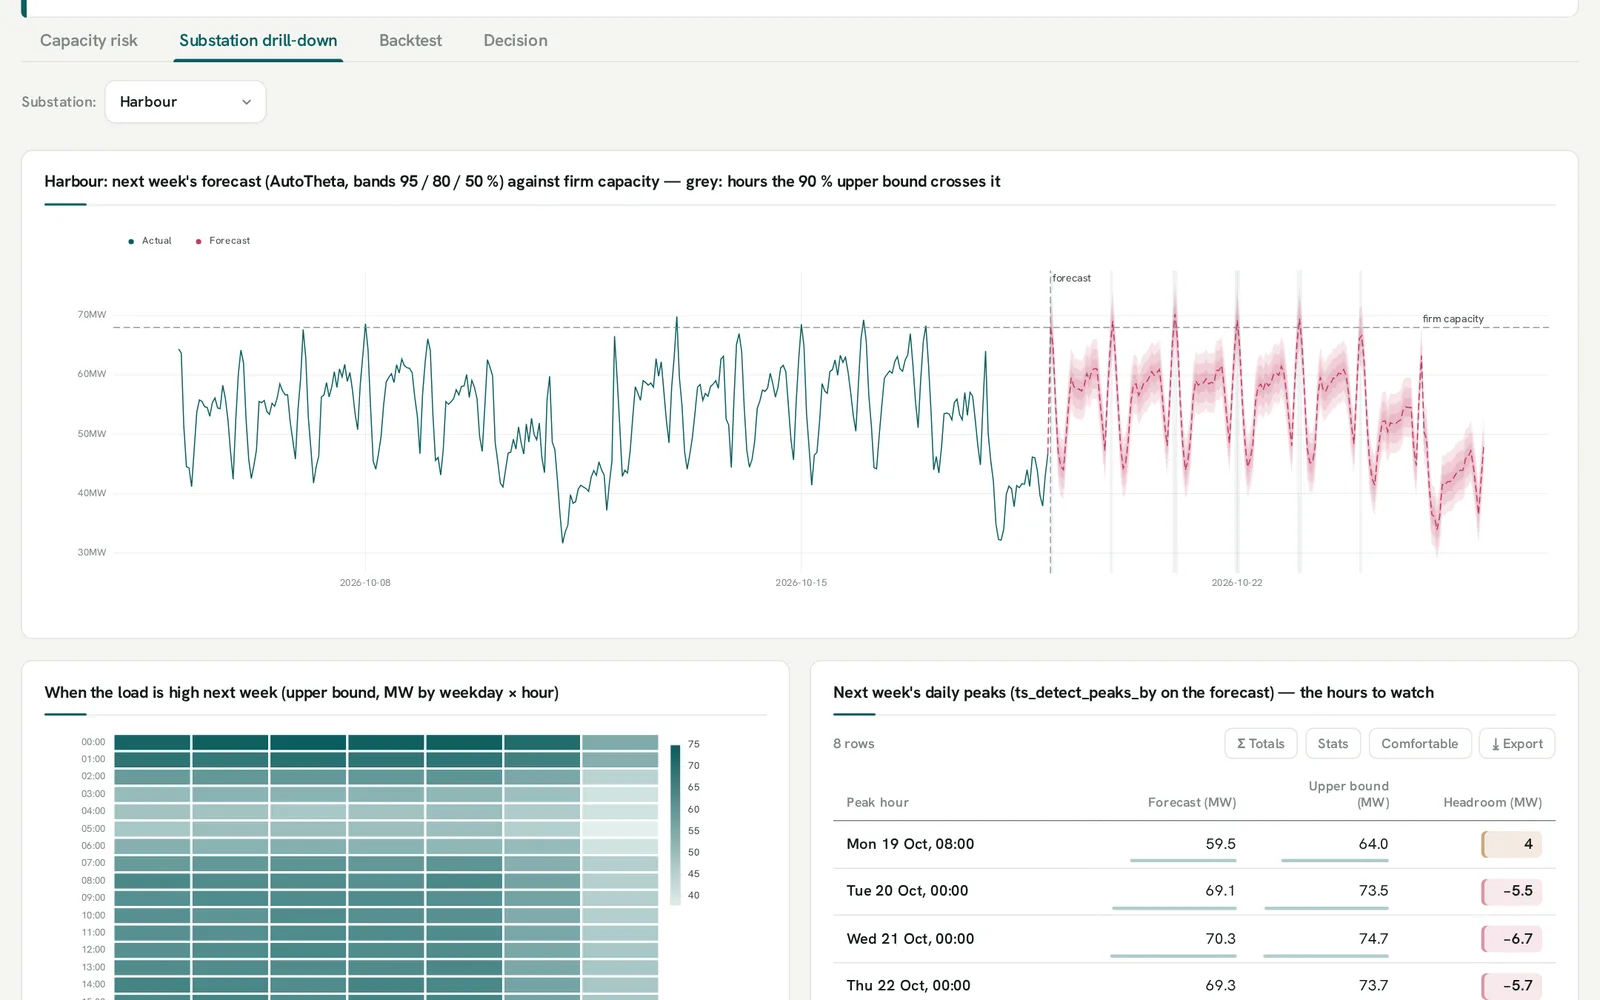
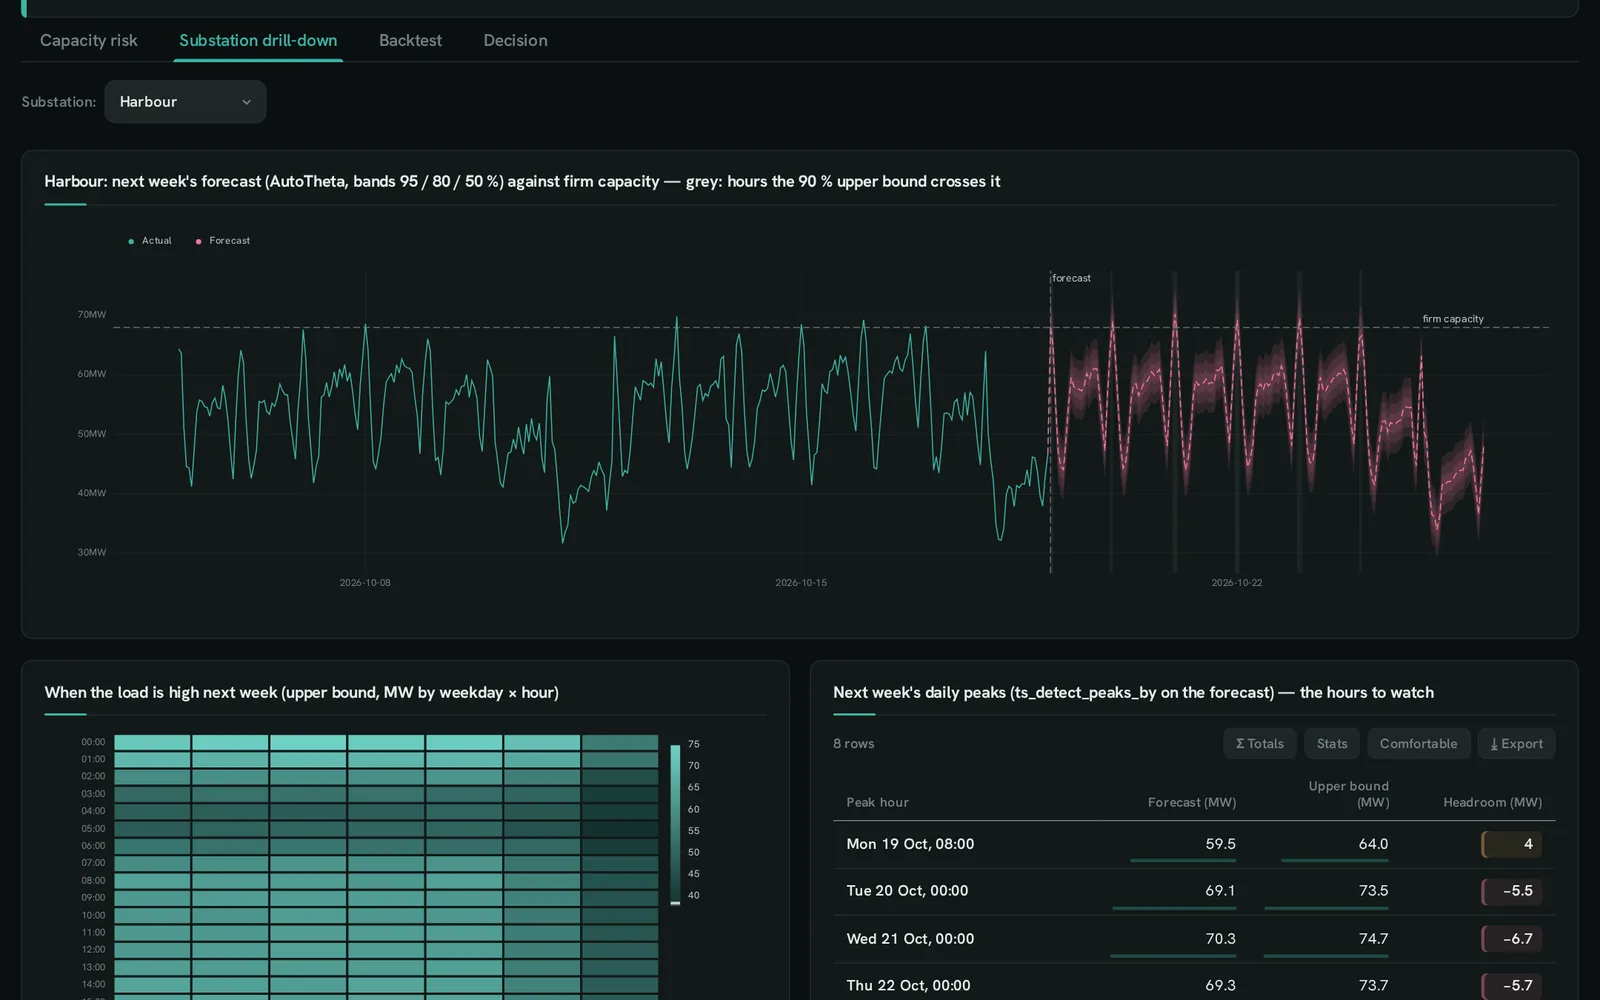


Real dashboards from the builder’s examples — a forecast against capacity, a map that drills — each one .sql file.
- 42 chart kinds
- 248 roles
- 40 live examples
- 5 anofox extensions plotted
- 0 lines of JavaScript
From one line to an application
Section titled “From one line to an application”Start with a single chart. Every step below adds a few lines to the same file — nothing has to be rewritten when it grows.
A chart is one SELECT
Section titled “A chart is one SELECT”The cast on the measure picks the chart; the other columns say where each row goes. Sort and aggregate in SQL — the chart draws what the query returns.
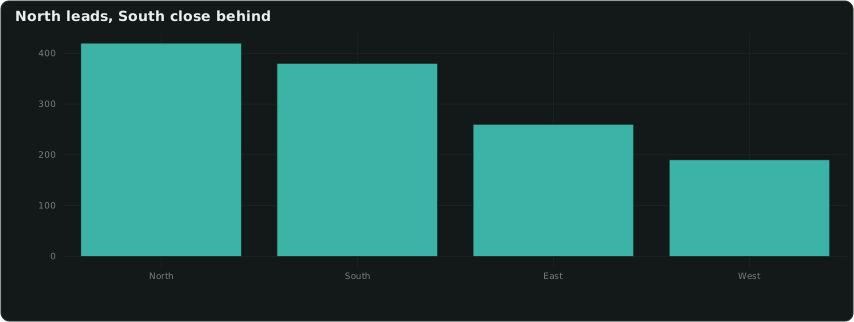
SELECT region ::XAXIS, sum(revenue) ::BARCHART, 'North leads, South close behind'::TITLEFROM sales GROUP BY ALL ORDER BY 2 DESC;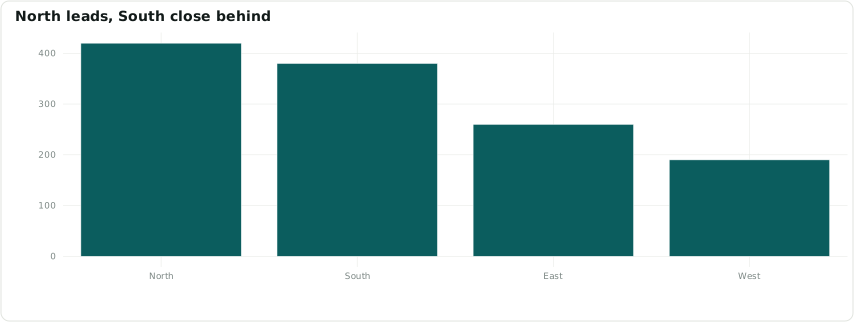
A dashboard is a few more
Section titled “A dashboard is a few more”KPI tiles with change, trend line and goal; a 12-column grid; boxes, tabs and sections — each a statement of its own.
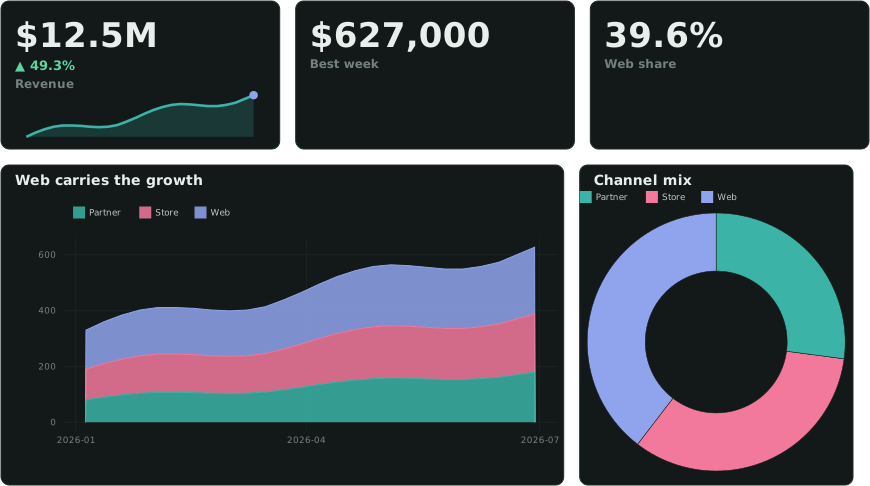
SELECT 'Headline'::GROUP;SELECT sum(revenue) ::MONEY, 'Revenue'::LABEL, sum(revenue_prev) ::DELTA, list(r ORDER BY week) ::SPARKLINE FROM …;SELECT 1::ENDGROUP;SELECT 8::COL;SELECT week ::XAXIS, channel ::CATEGORY, revenue ::AREACHART_STACKED FROM sales;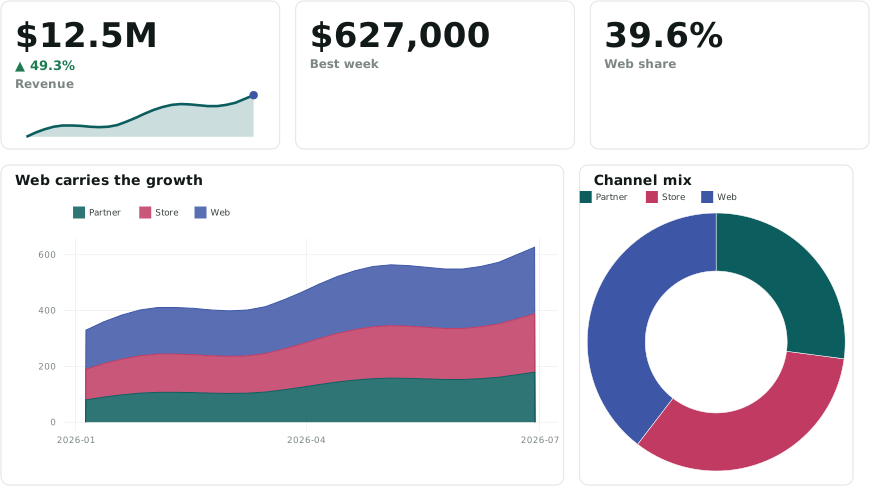
Interaction is variables
Section titled “Interaction is variables”An input’s column name is a DuckDB variable. Clicks set variables too: cross-filter, named selections, row selection, and drill-down through any hierarchy — on bars, maps and treemaps.
SELECT 'geo: country > state > district'::DRILL;SELECT code ::REGION, name ::LABEL, revenue ::BARCHART, 'quantile 5'::CLASSESFROM rm_level() -- reads getvariable('country'), …ORDER BY revenue DESC;Forecasts and models, in the same SQL
Section titled “Forecasts and models, in the same SQL”Load an anofox extension and plot its results: forecasts with nested interval fans, backtests, regression forests, survival curves, optimiser plans. Here: next week’s load per substation, three methods backtested, against firm capacity.
LOAD anofox_forecast;CREATE TABLE fc ASSELECT * FROM ts_forecast_by('load', substation, ds, mw, 'MSTL', 168, '1h', MAP{'seasonal_periods': '[24,168]'});SELECT ds ::XAXIS, yhat ::LINECHART, yhat_lower ::BAND_LOWER, yhat_upper ::BAND_UPPER, firm_mw ::REFLINE, 'firm capacity' ::REFLINE_LABELFROM fc JOIN substations USING (substation)WHERE substation = getvariable('substation');Ship it — to a page, a server or an agent
Section titled “Ship it — to a page, a server or an agent”The same file renders to HTML and SVG in CI, publishes as a static site, or runs on a locked, read-only server with login, row and column policies, scheduled reports and alerts. A dashboard’s -- @question lines can be answered over REST and MCP for the signed-in caller.
dashboard --check sales.sql --strict # lint in CIdashboard --site dashboards/ public/ # a static siteserve --dashboards dashboards/ \ --db sales.duckdb --options locked.jsonIdeas to start from
Section titled “Ideas to start from”Example dashboards on made-up sample data, each built around a question a team might ask. Open one, read its SQL, change it.
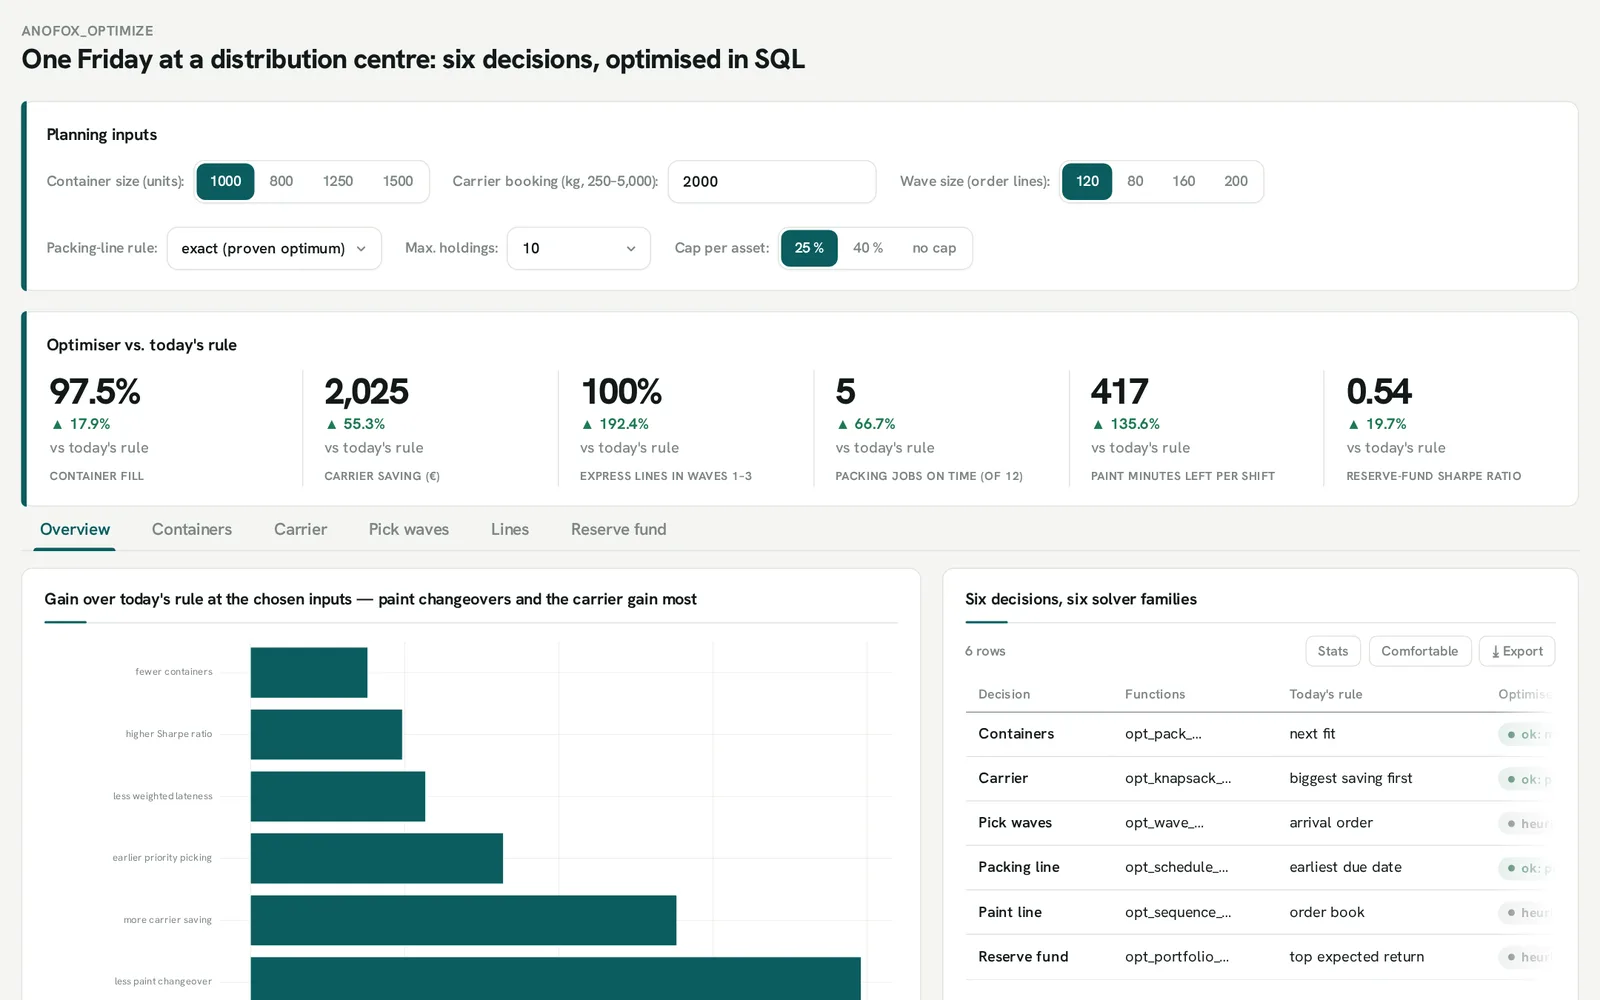
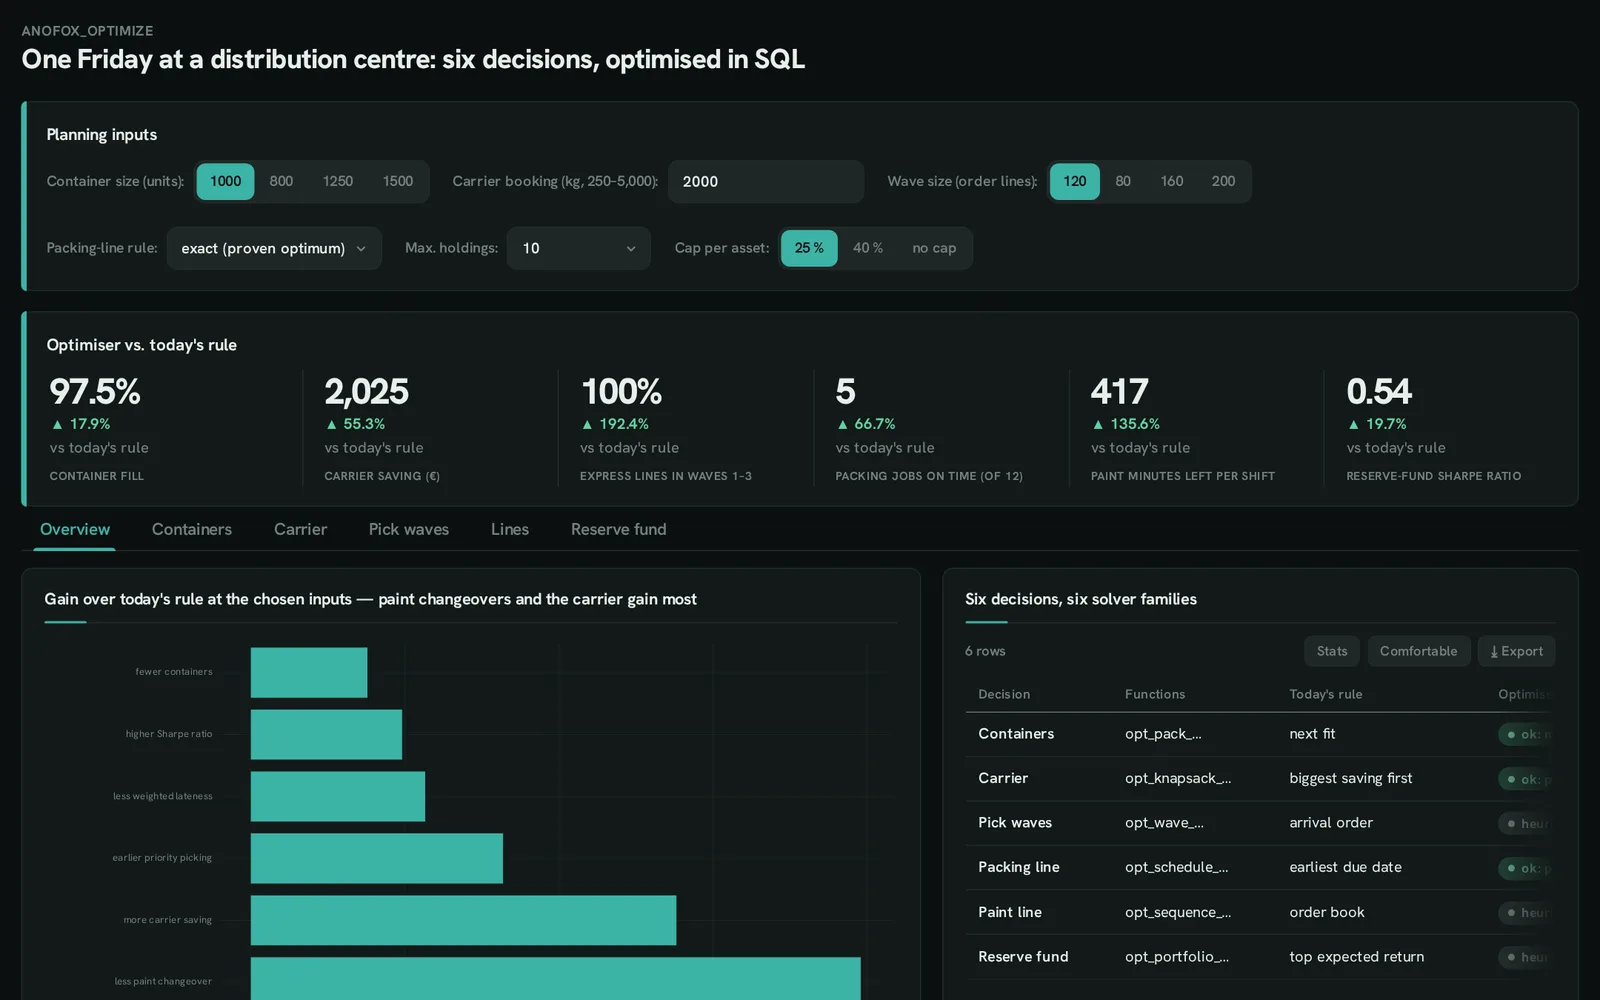 anofox-optimizeHow do we plan a busy day at the distribution centre?Six solvers — packing, carrier, waves, sequencing — against today’s rule.
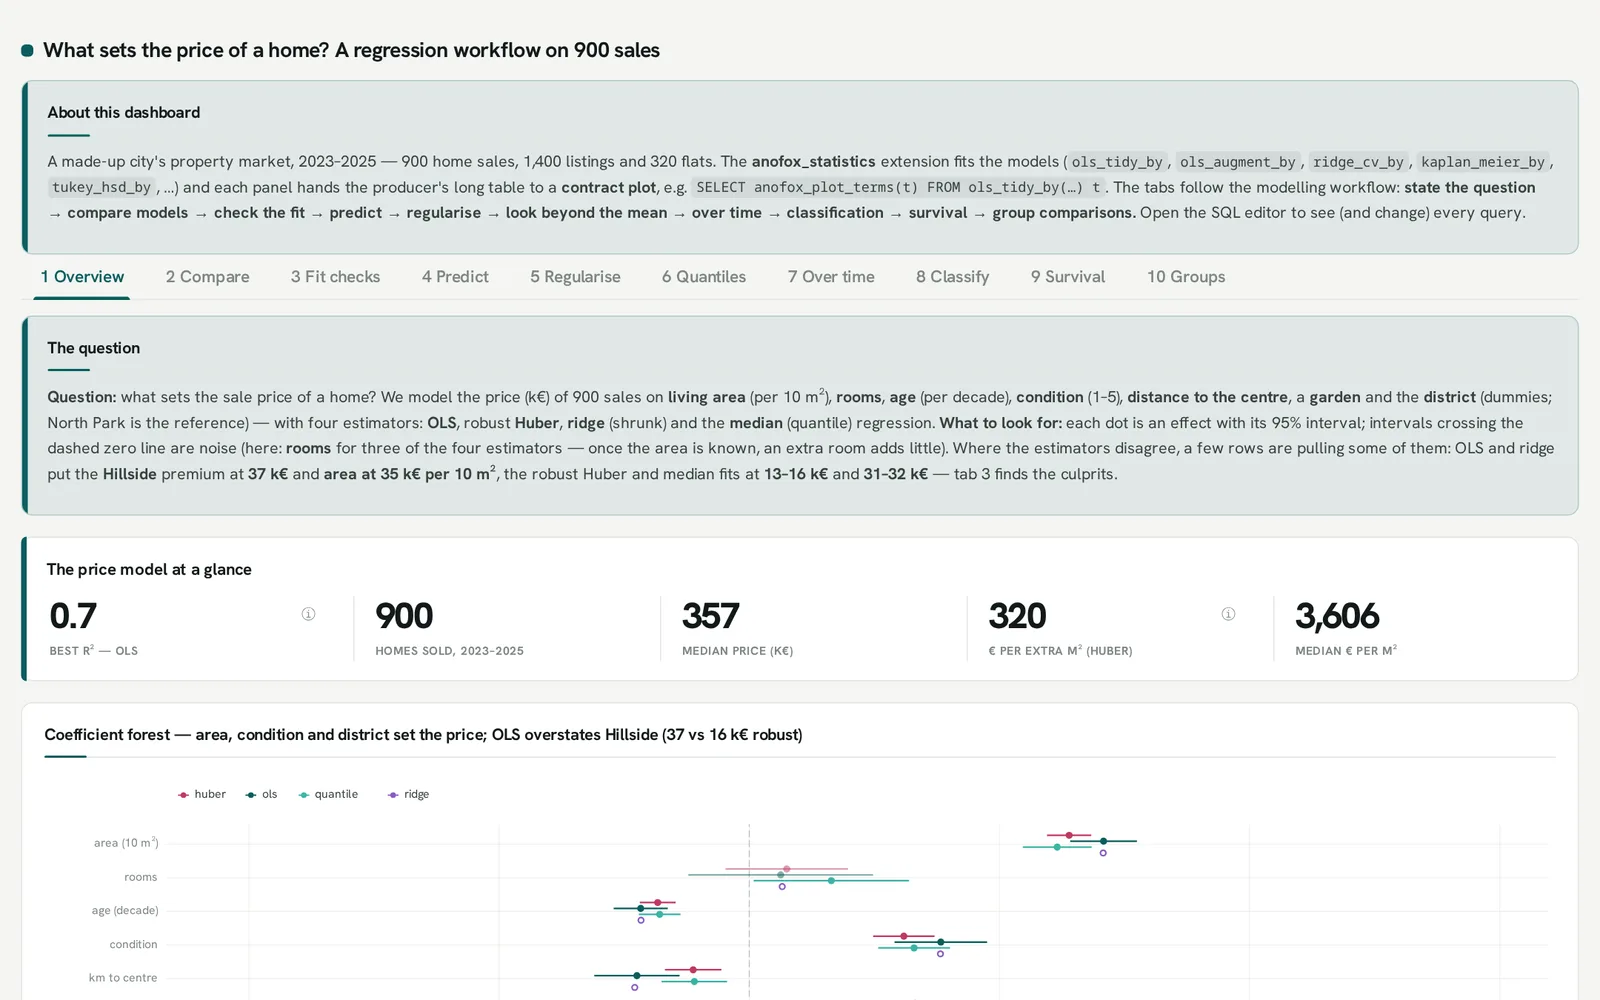
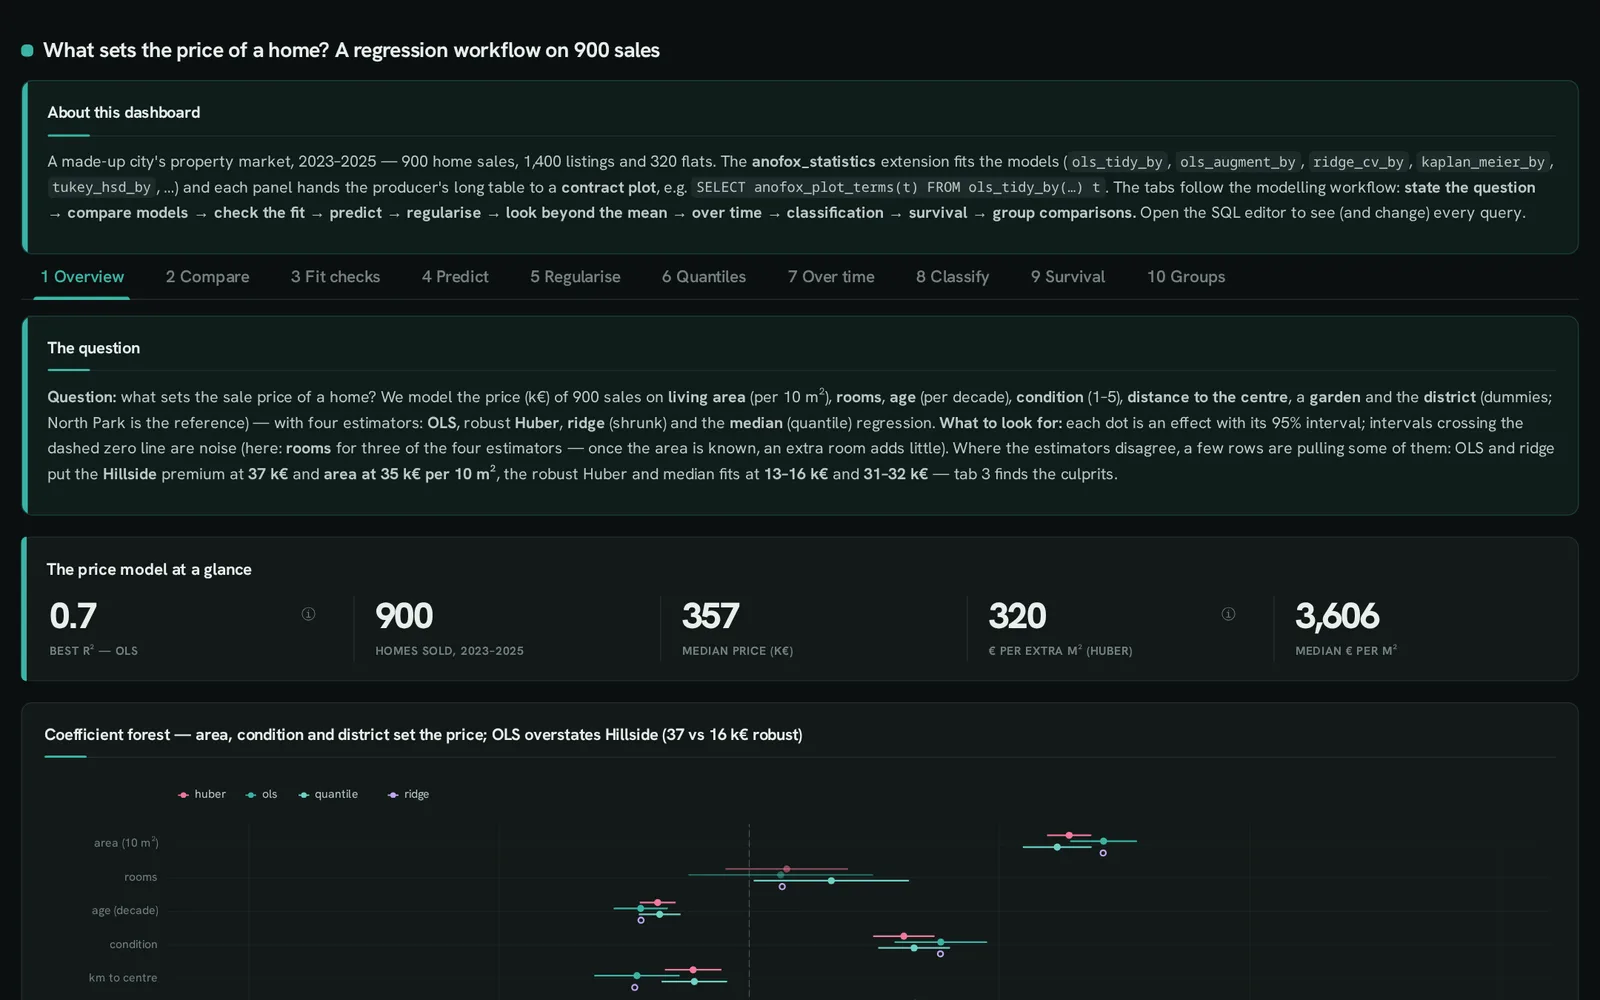 anofox-statisticsWhat sets the price of a home?A regression workflow in ten tabs: compare, check, predict, regularise, survival.
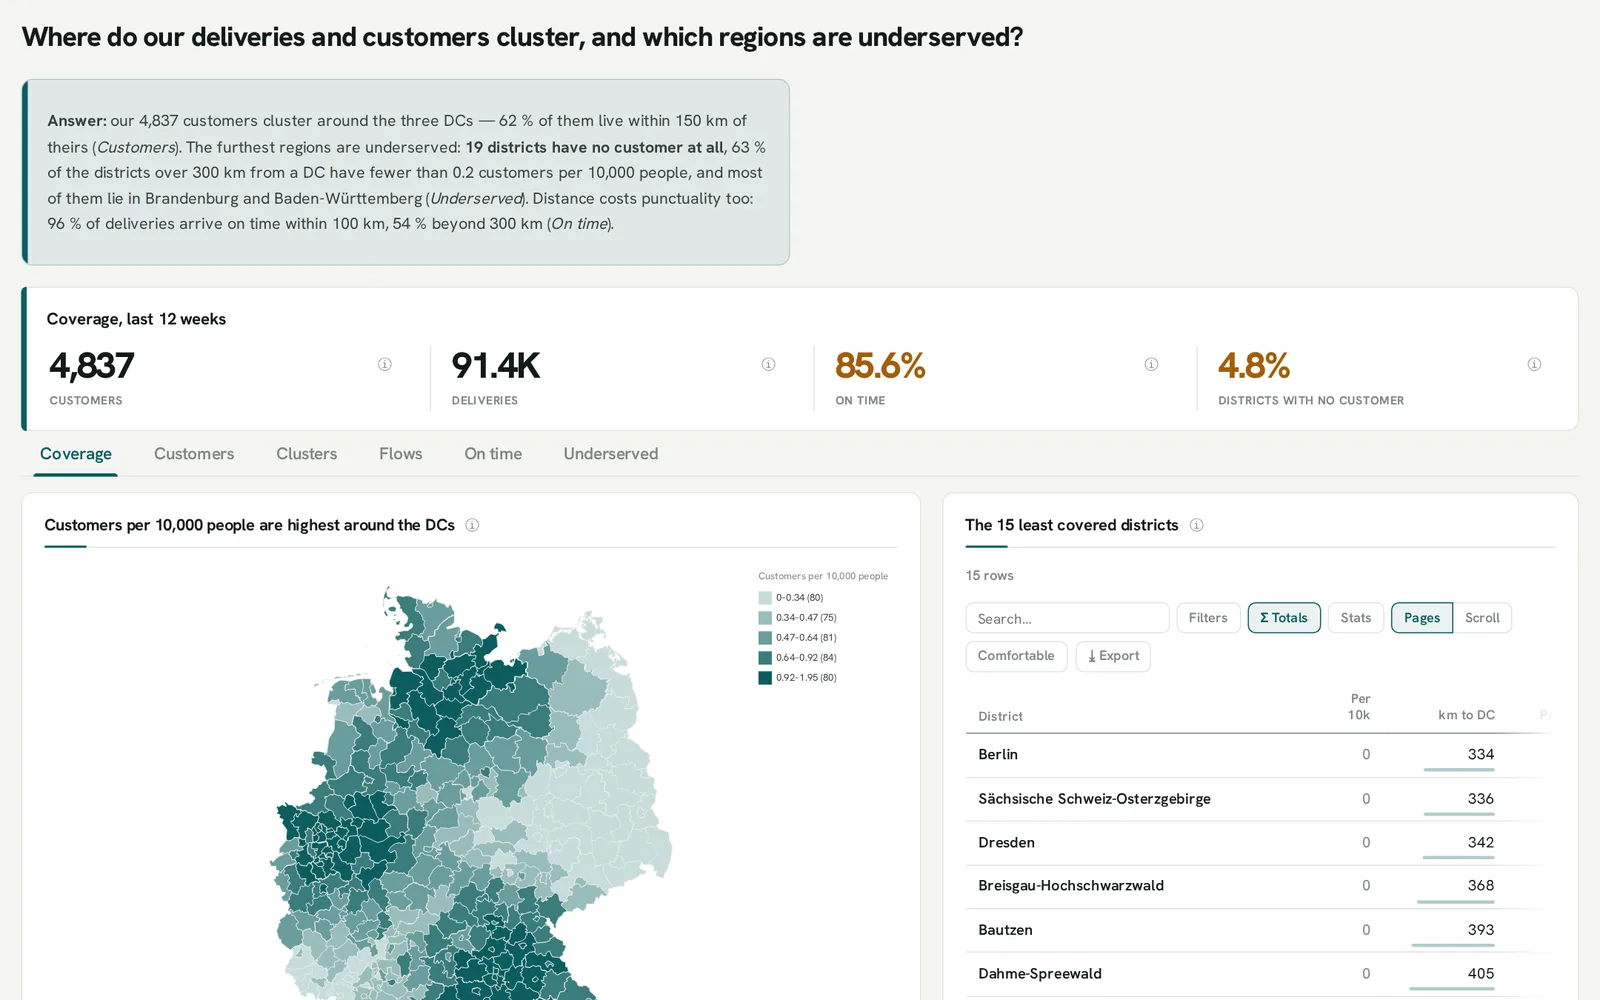
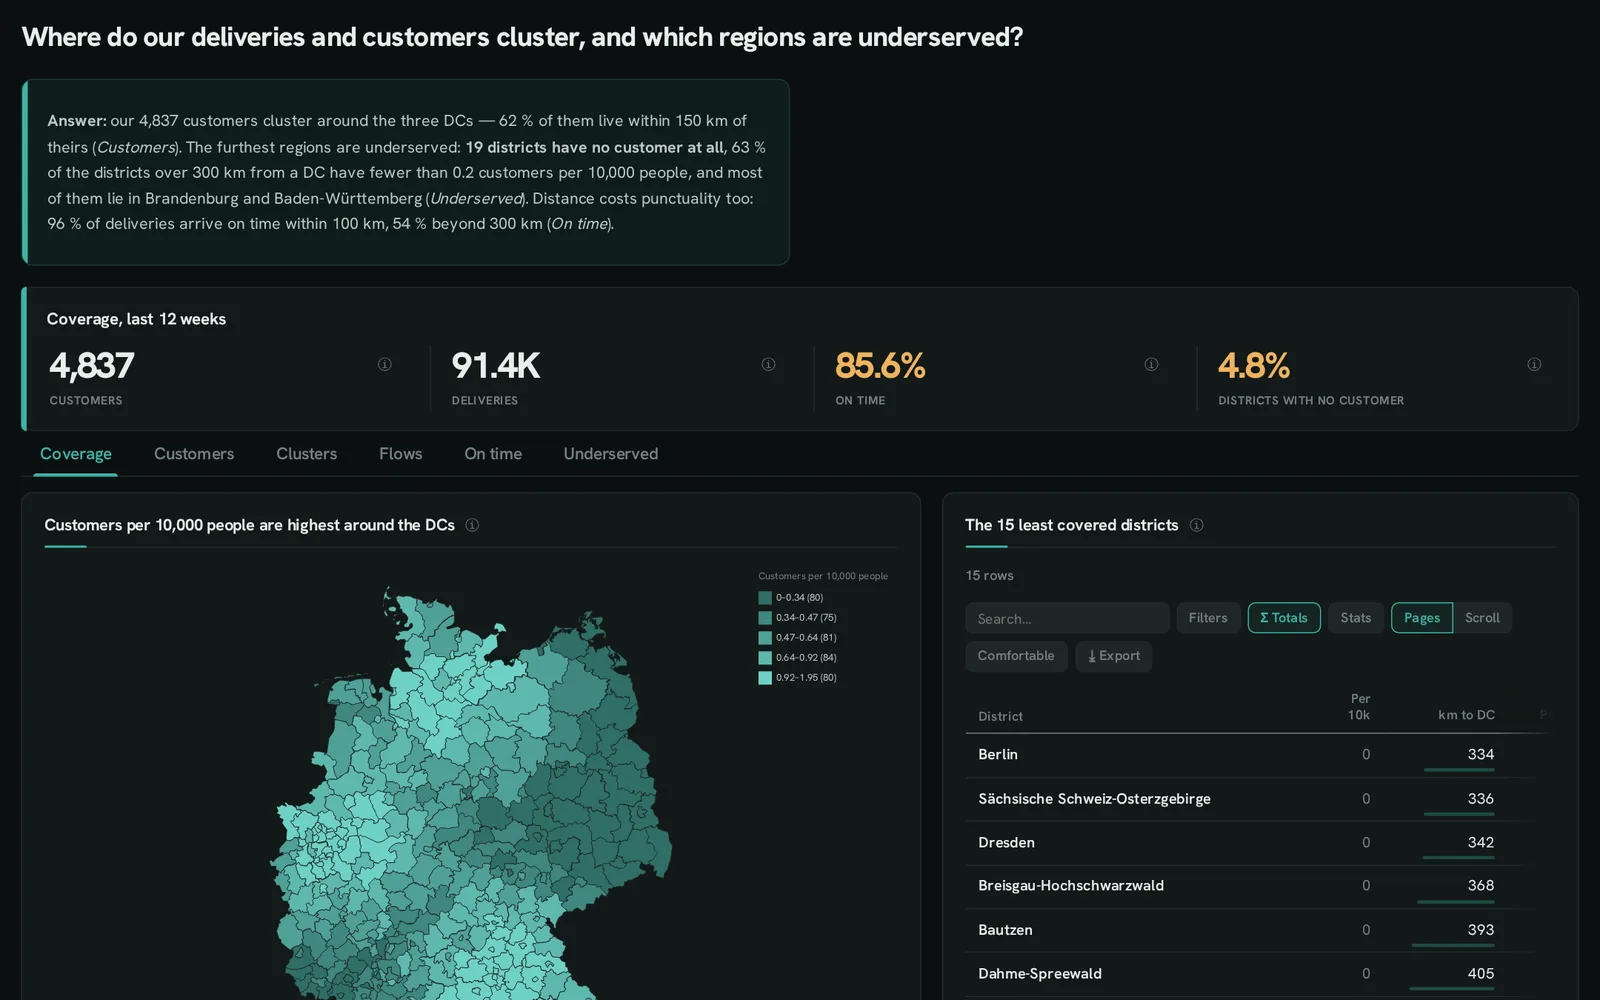 mapsWhere do our customers cluster, and which regions are underserved?Districts, points, flows and clusters on built-in boundaries.
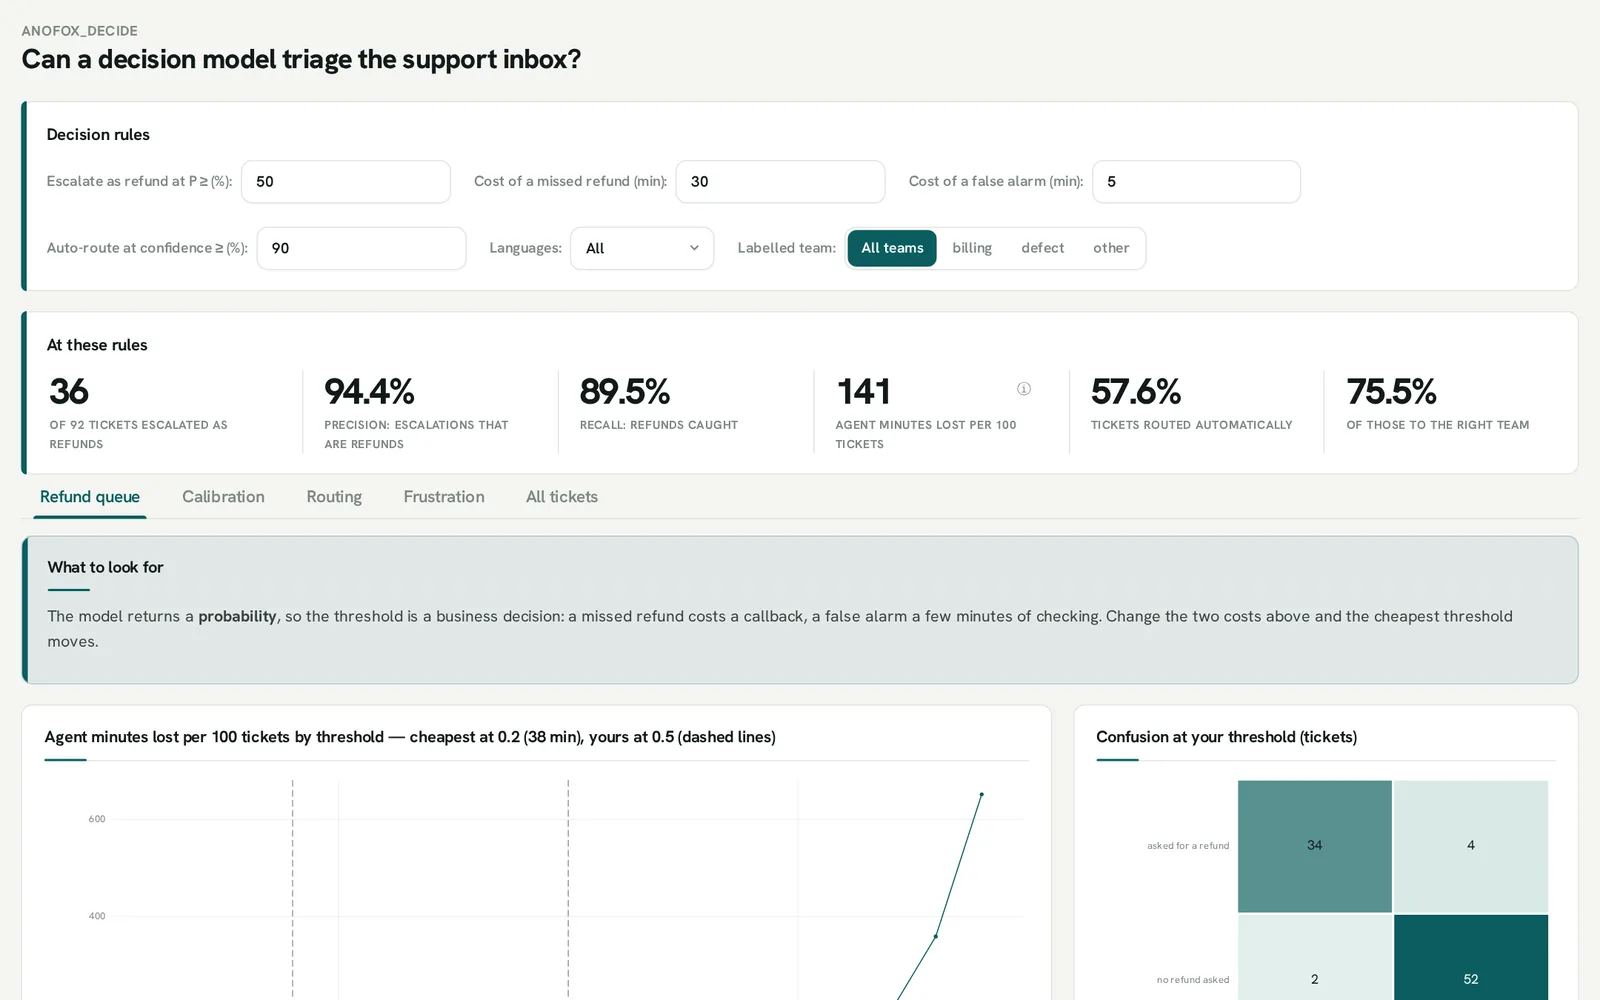
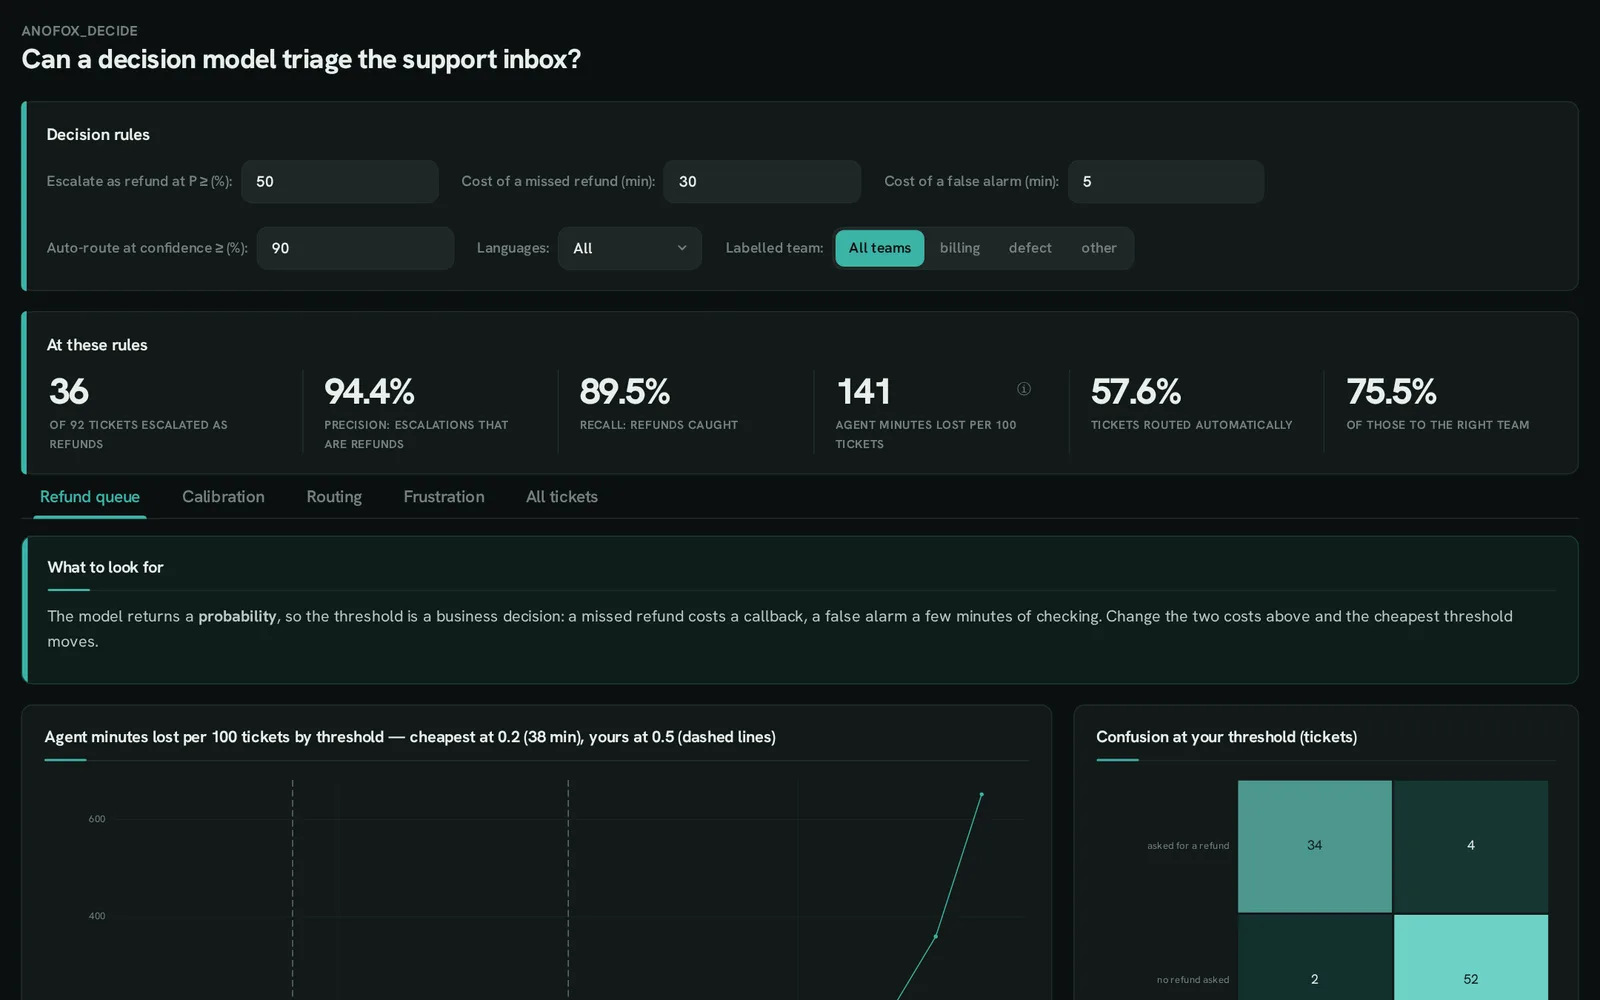 anofox-decideCan a model triage the support inbox?Probabilities to decisions: thresholds, costs, calibration, routing.
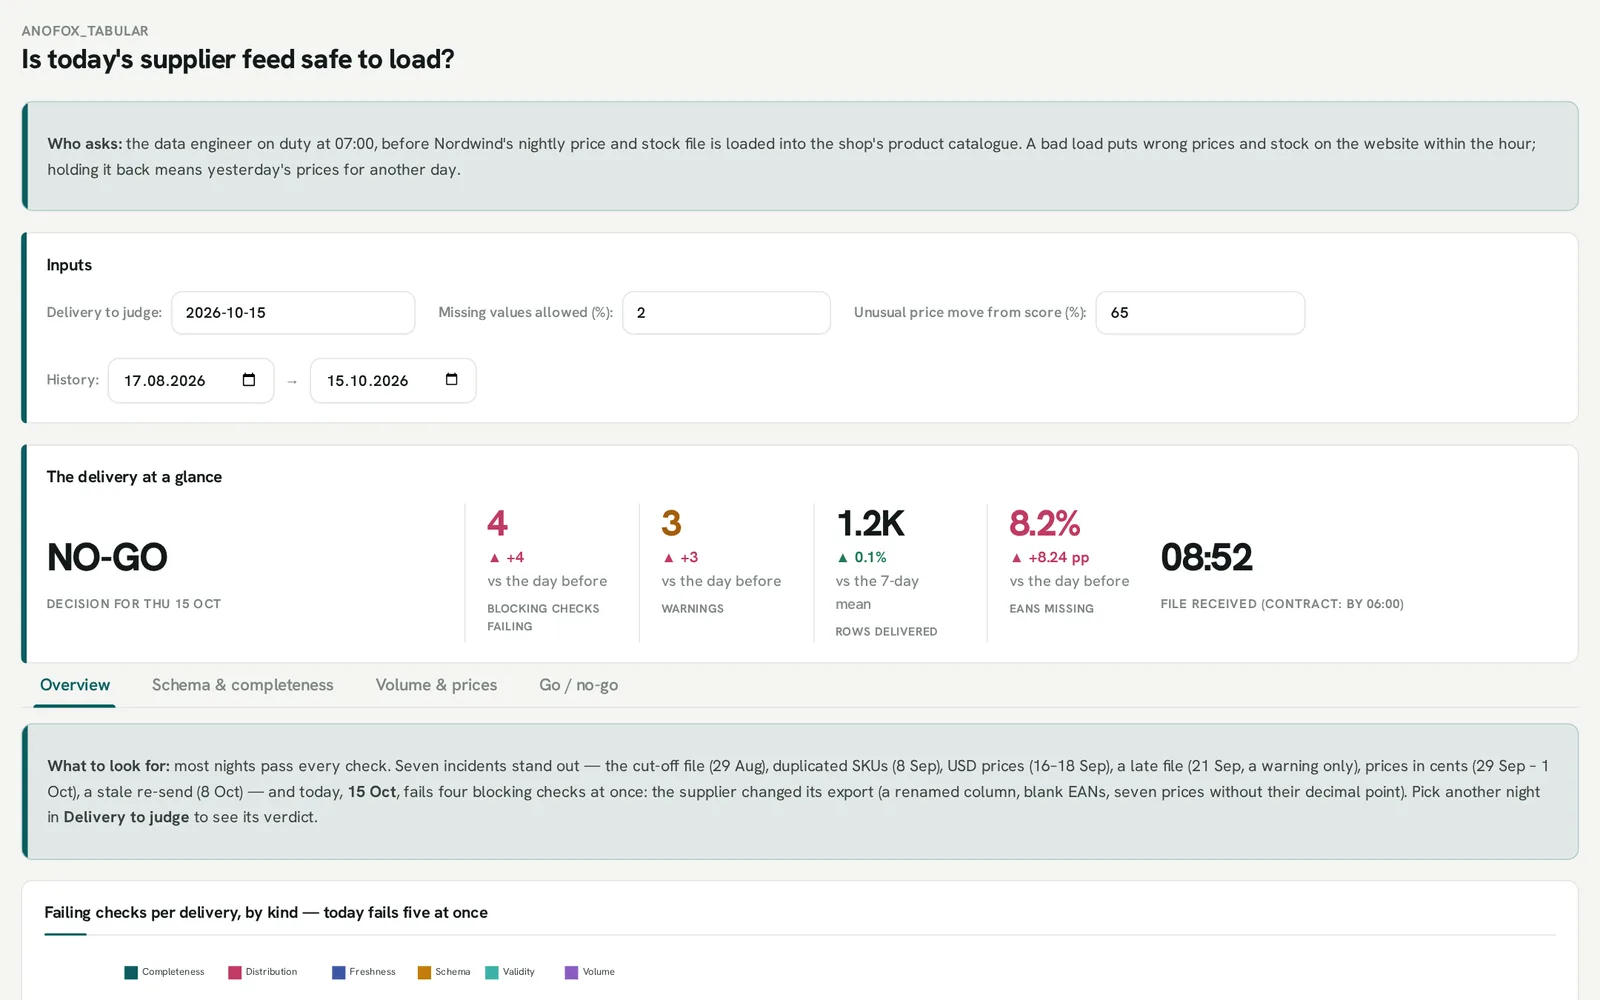
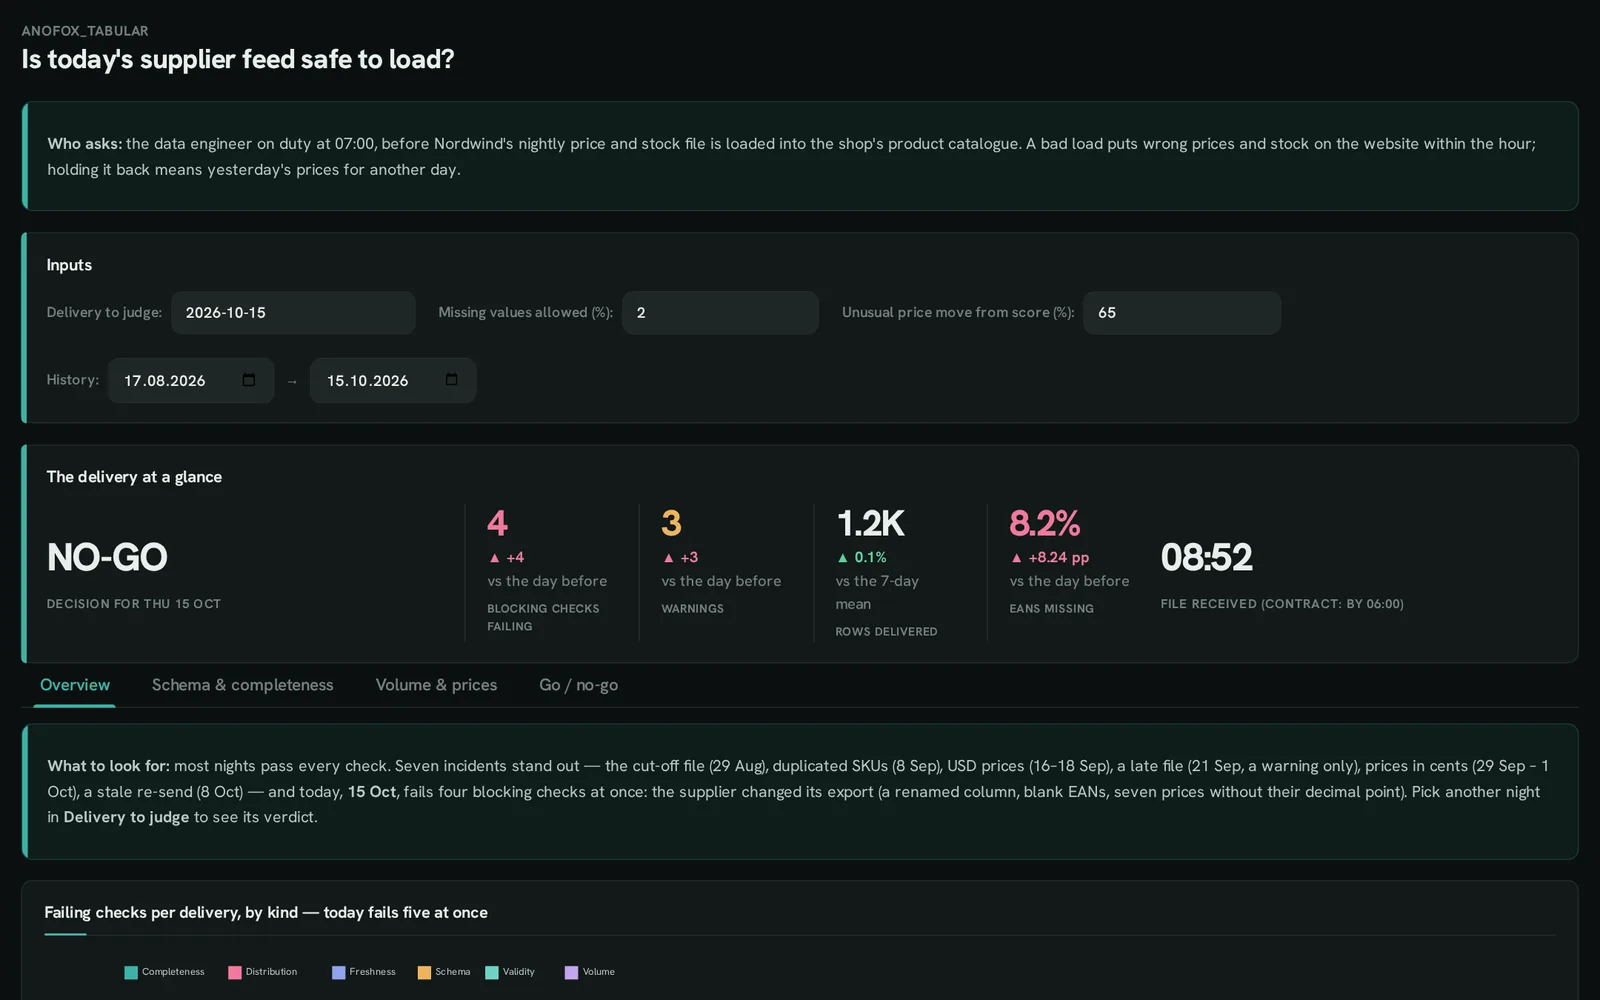 anofox-tabularIs today’s supplier feed safe to load?Data-quality checks, a go / no-go verdict and the history behind it.
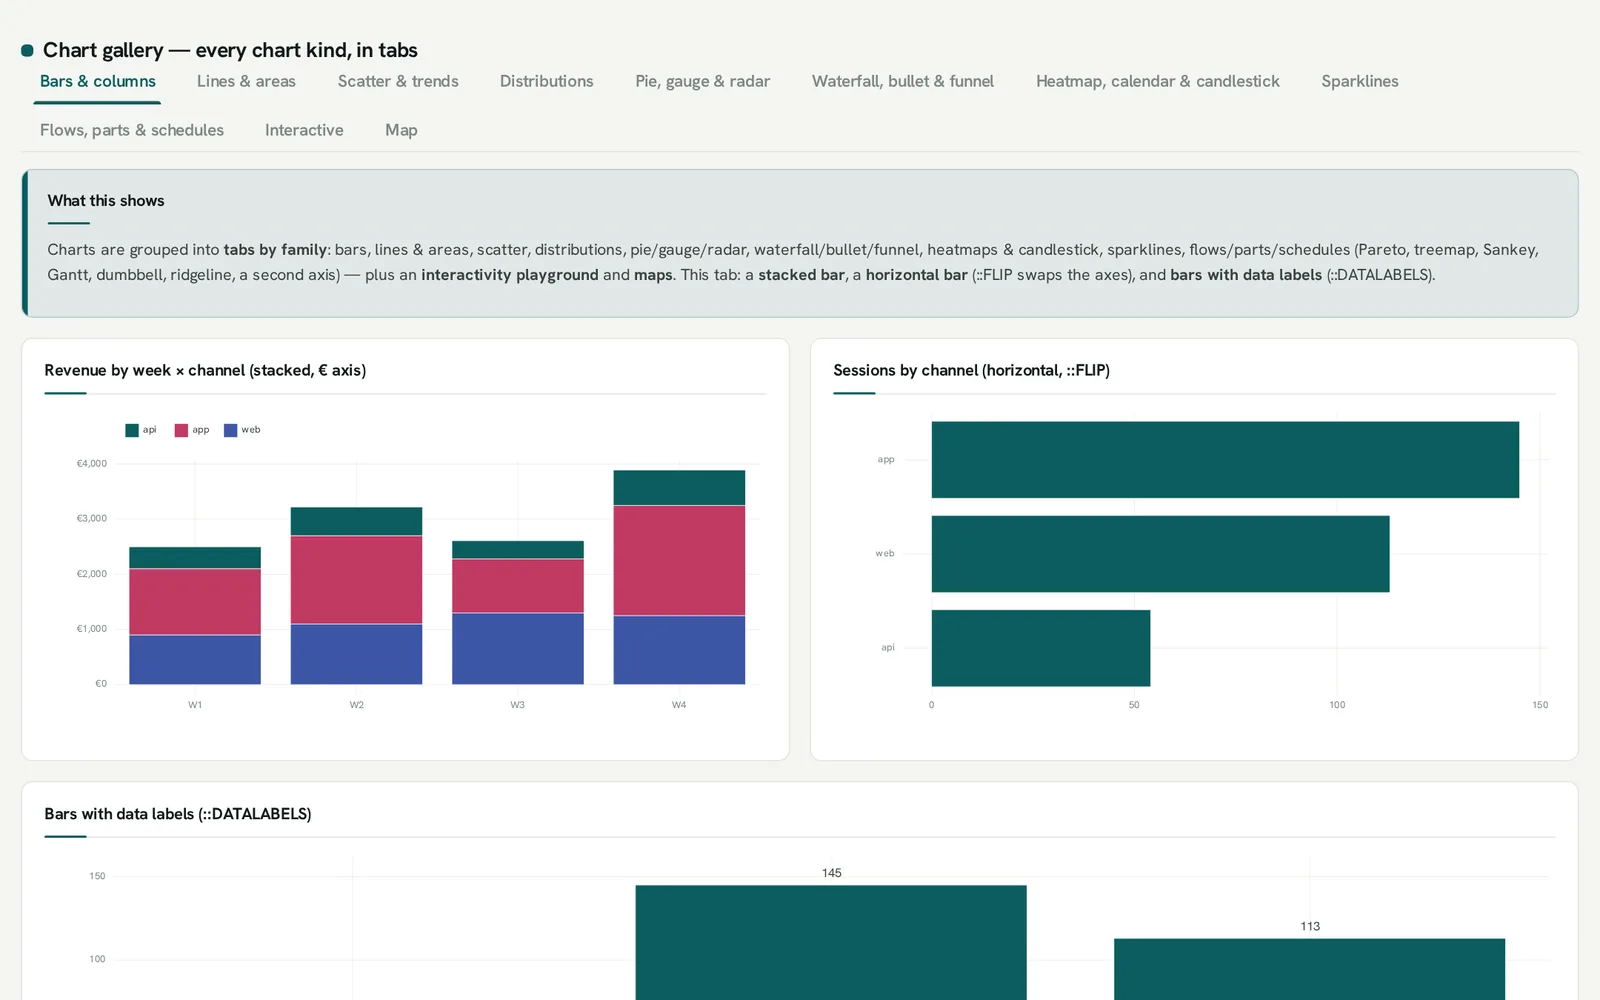
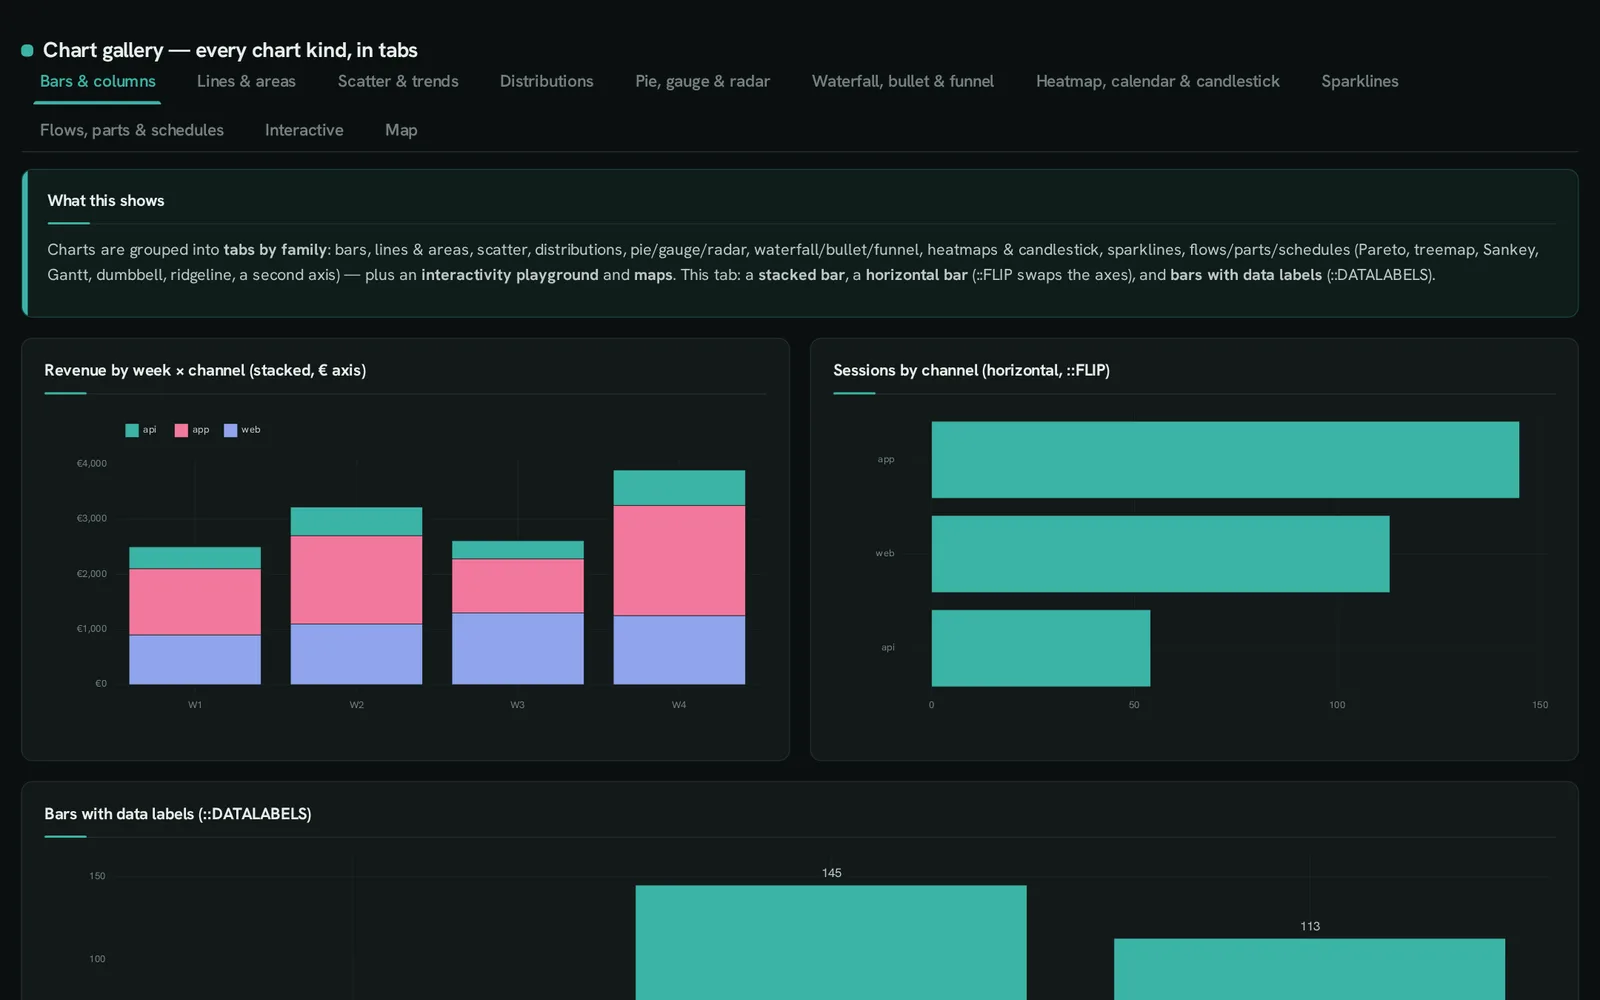 chart galleryWhich chart fits which question?Every chart kind, by family, with the SQL beside it.
Everything, with its SQL
Section titled “Everything, with its SQL”The gallery shows every input, KPI, table option, map and interaction as a picture with the SQL that draws it — and what each anofox extension plots.
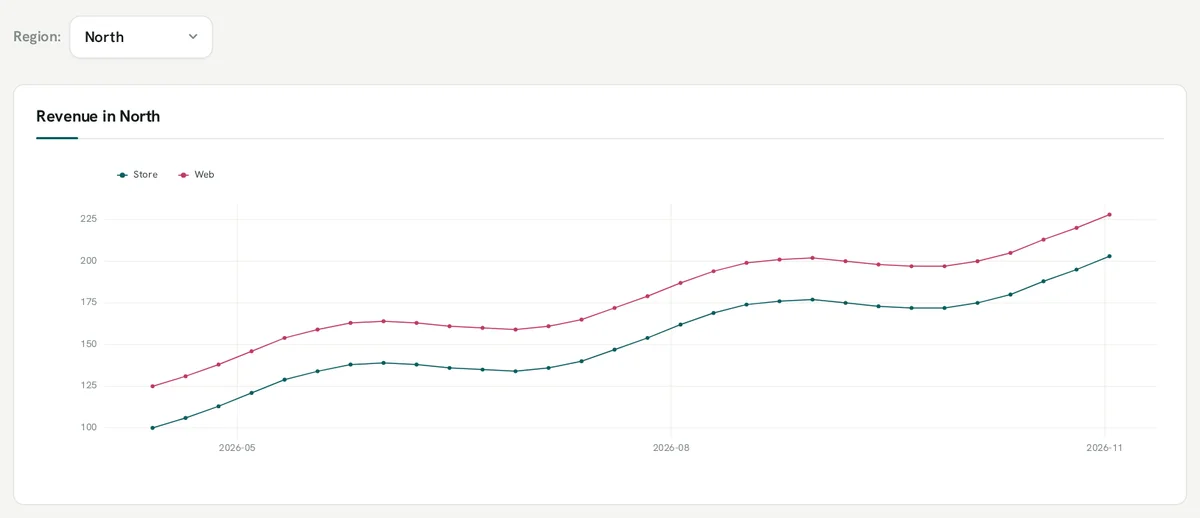
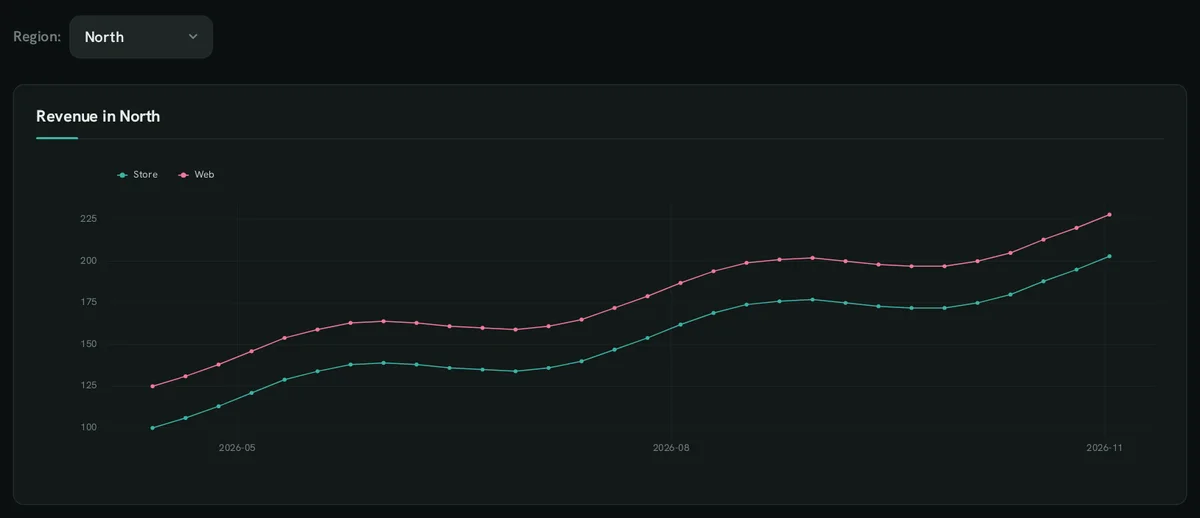 Inputs and filters8 controls, each driving a chart
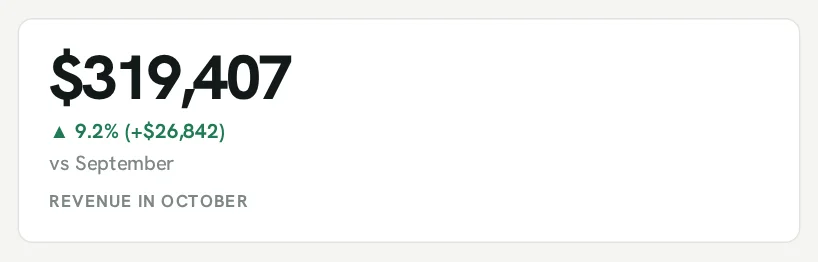
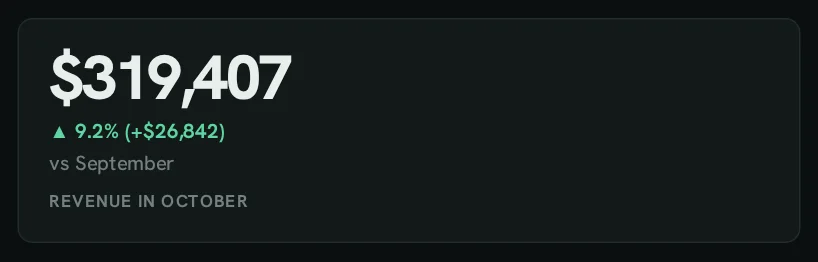 KPIschange, trend, goal, status
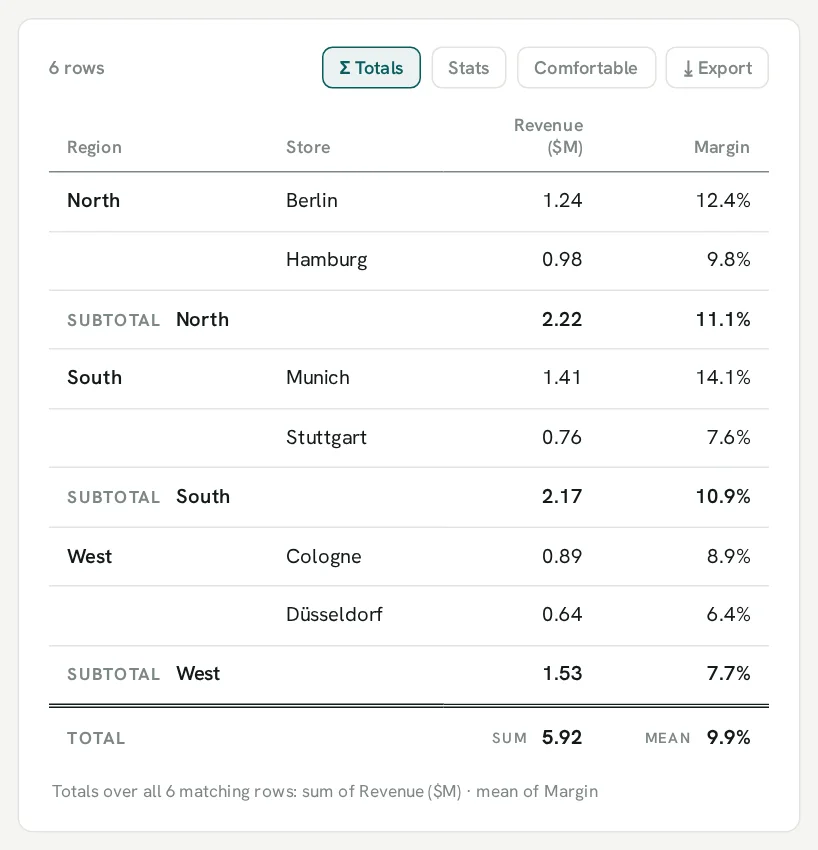
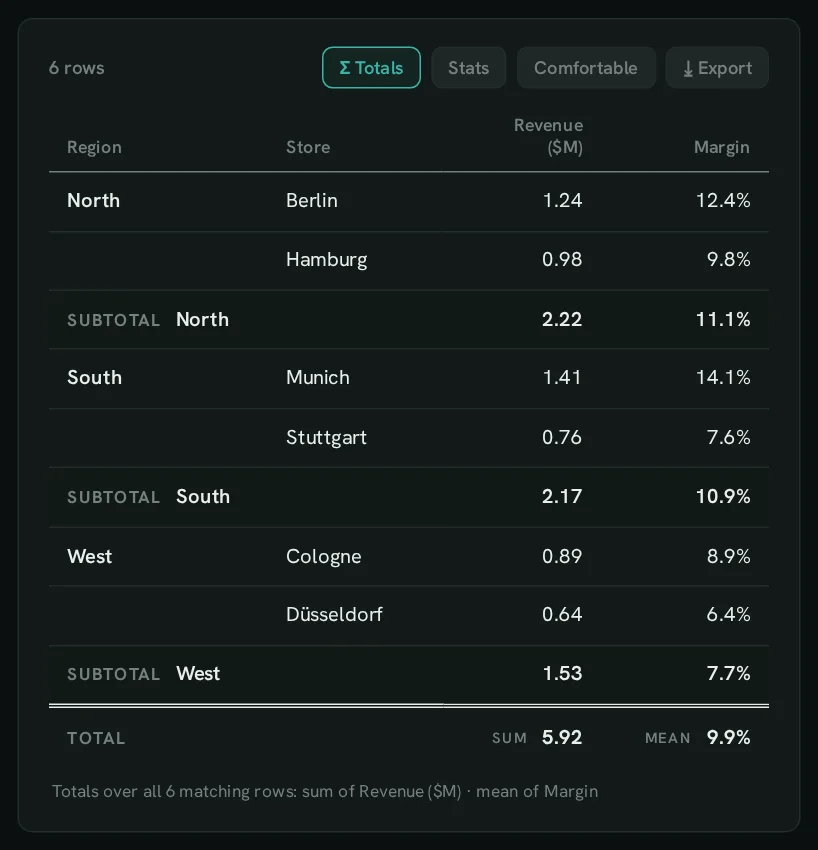 Tablesformats, subtotals, flags, links
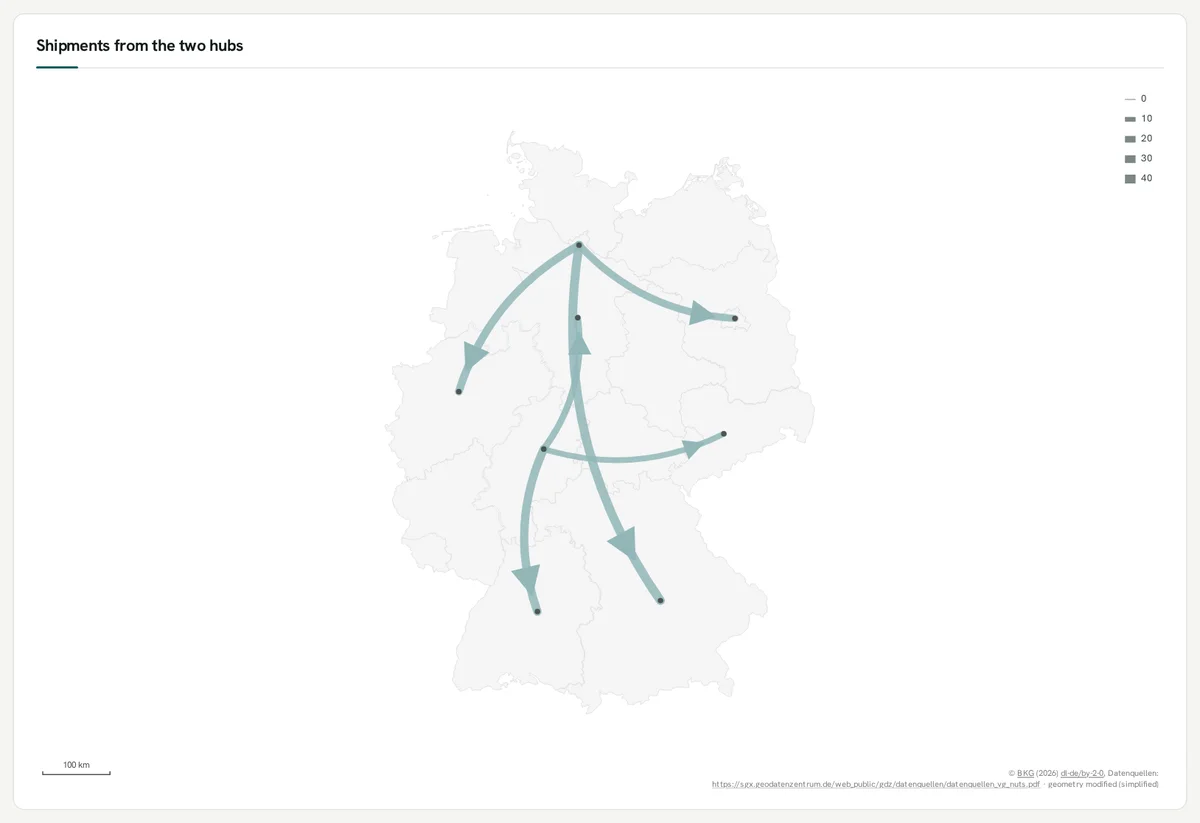
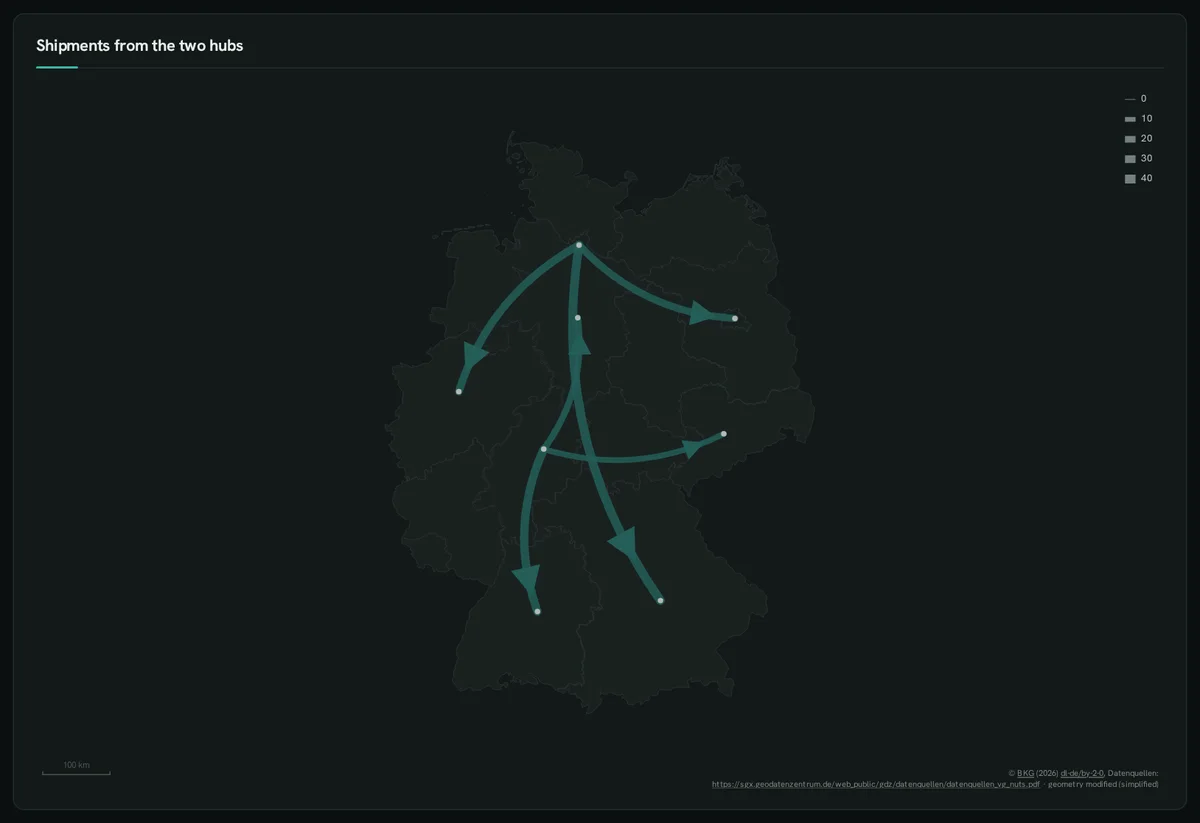 Mapsregions, points, flows, drill
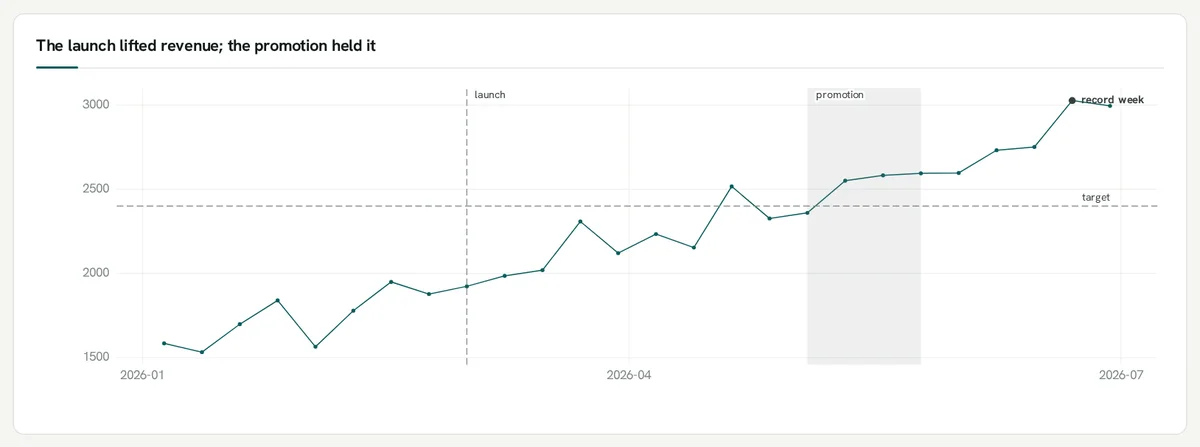
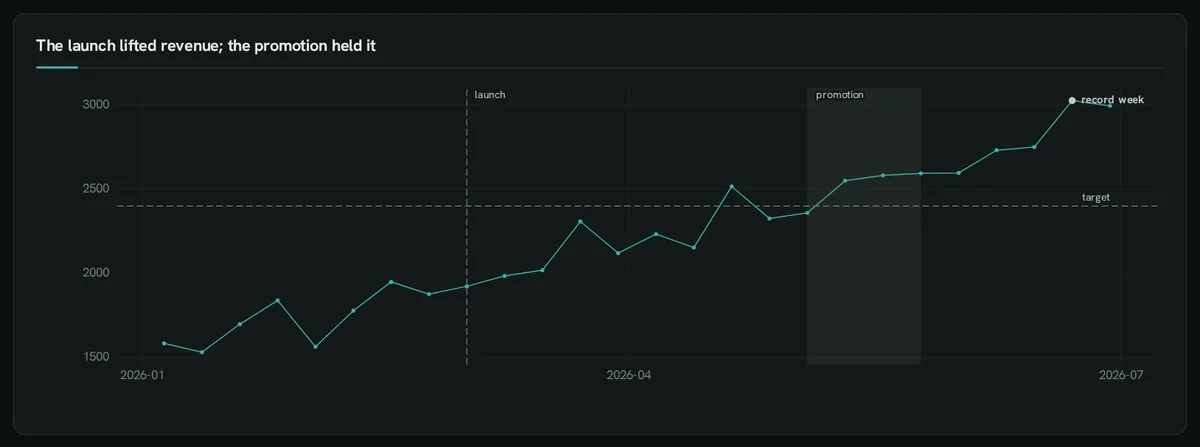 Interactionsdrill, views, figures, steps
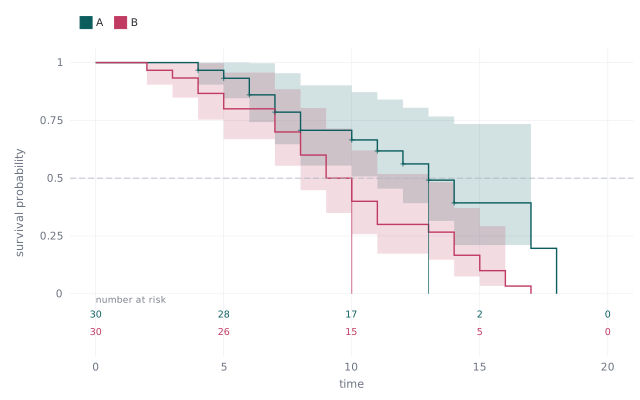 Extension plotsstatistics, forecast, tabular, optimize, decide
42 chart kinds, one grammar
Section titled “42 chart kinds, one grammar”Rendered to crisp SVG by ggplot-rs, a grammar-of-graphics engine in Rust — the same picture in the browser, the CLI, a PDF export or an e-mail.
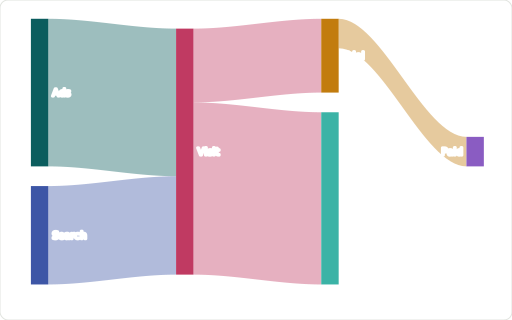
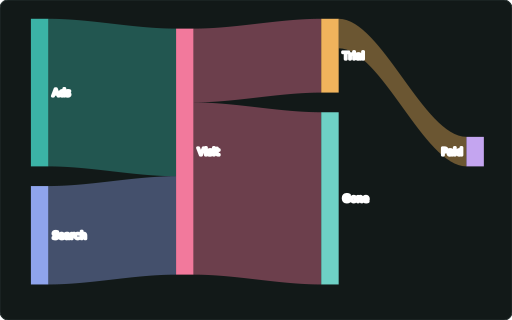
::SANKEY

::TREEMAP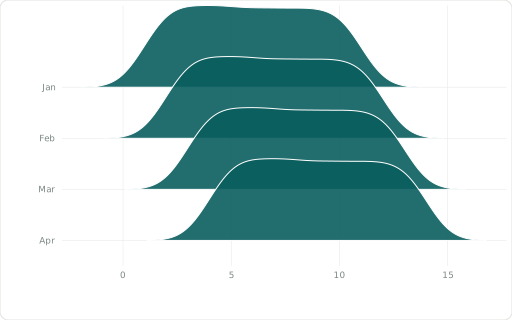
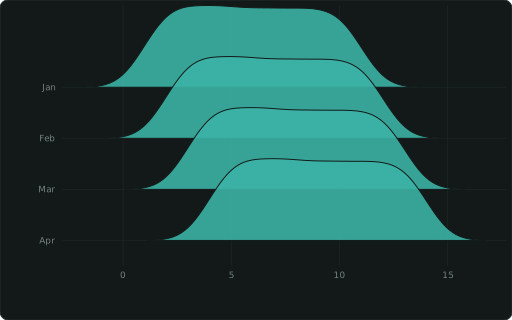
::RIDGELINE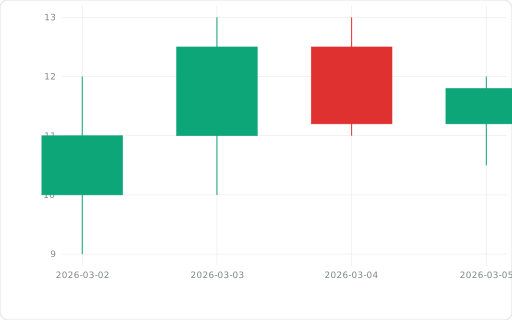
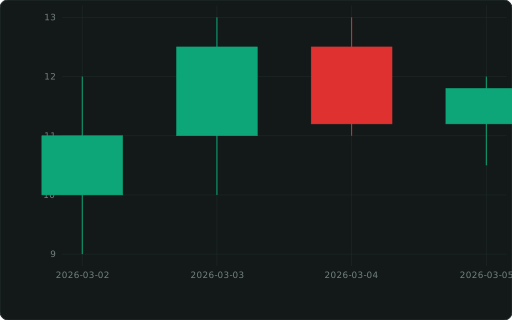
::CANDLESTICK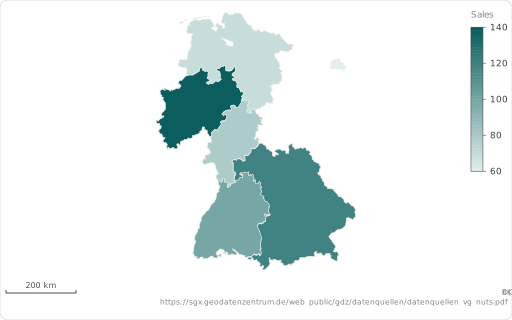
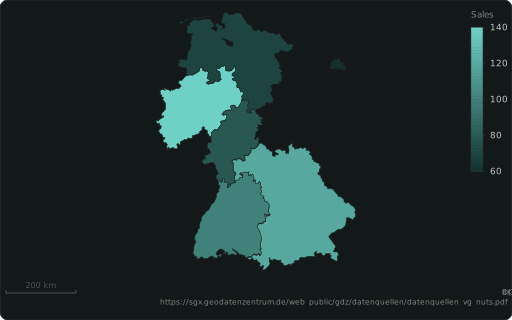
::REGION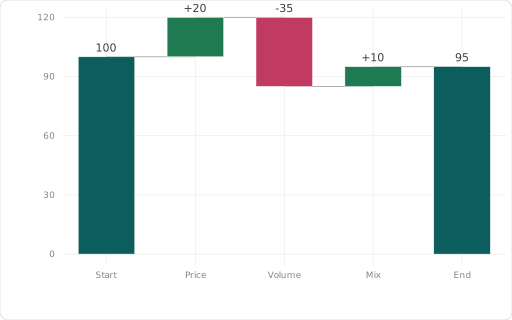
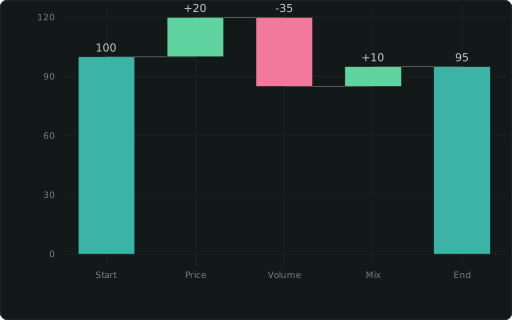
::WATERFALL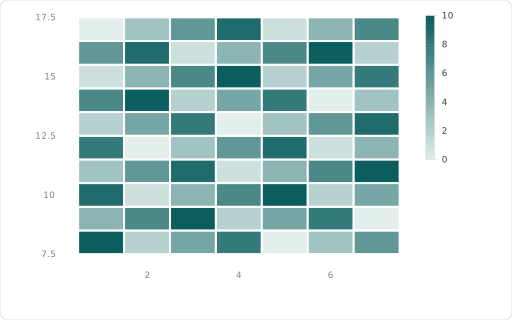
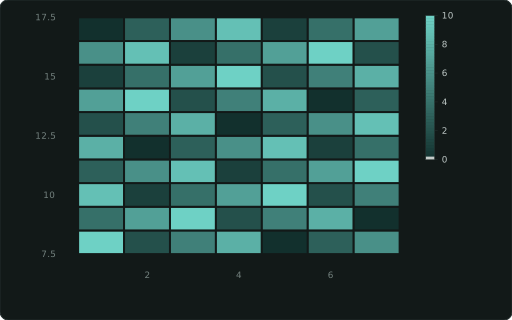
::HEATMAP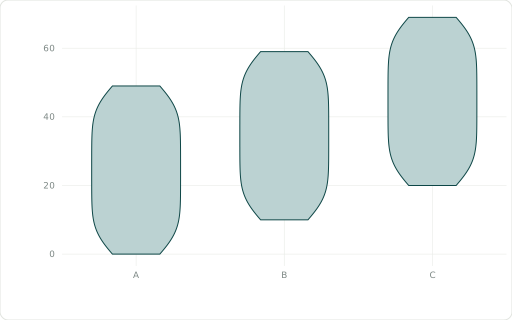
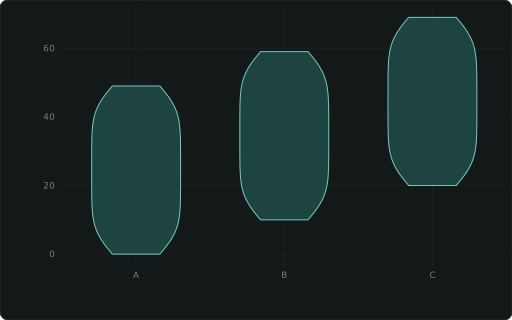
::VIOLIN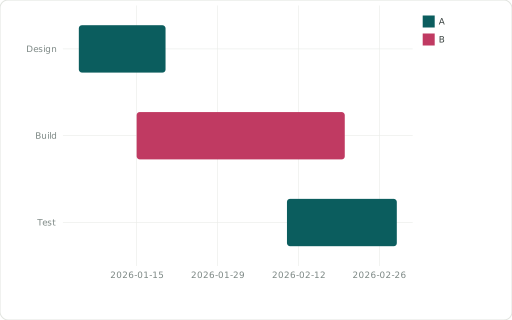
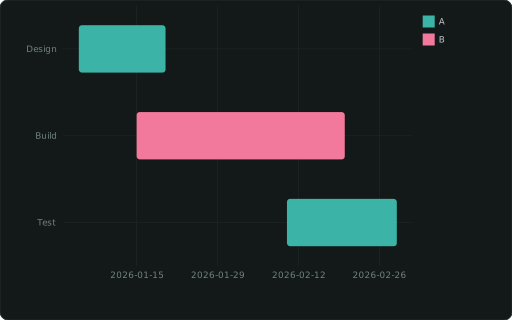
::GANTT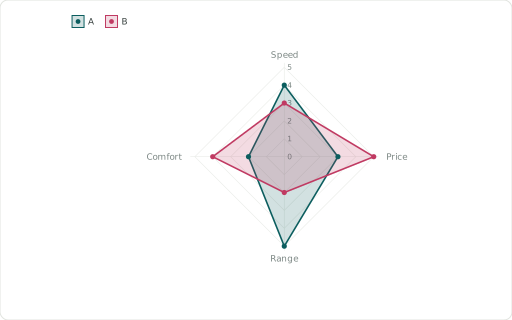
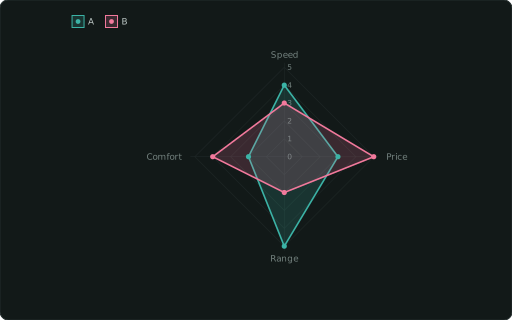
::RADAR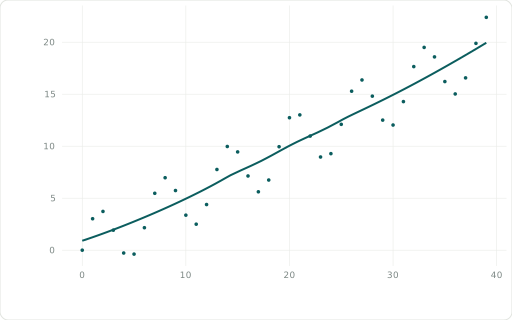
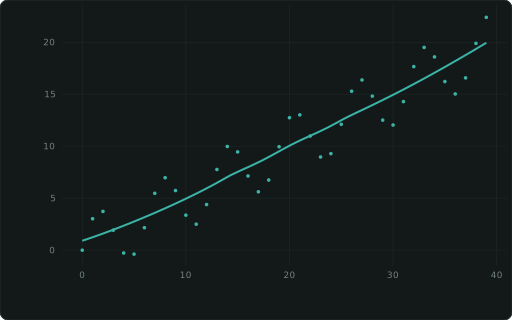
::SMOOTH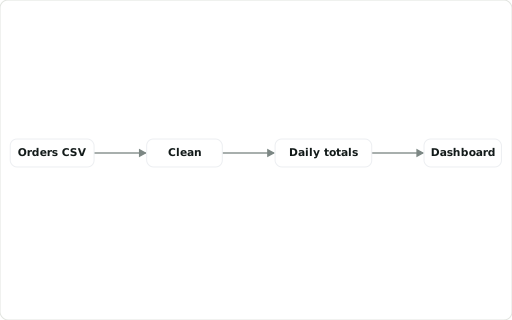
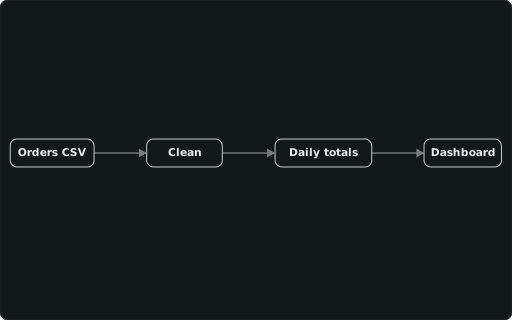
::DIAGRAMSee all 42, with the data each one needs →
Treated like code
Section titled “Treated like code”.sql file: review it in a pull request, diff it, blame it.dashboard –check catches broken SQL, empty panels and design mistakes; a GitHub Action runs it on every PR.Try it on your own data
Open the builder, load a CSV, Parquet or JSON file with Explore data, and tag a column.
Open the builder →Install the extension