
Interactions and special features
Beyond single charts: clicks that filter and drill, switchable views, composed figures, guided steps, annotations from data, diagrams, factor graphs — each a few lines of SQL.
The sample data every tile on this page uses
CREATE TABLE geo AS SELECT * FROM (VALUES ('EU','Germany','Berlin'),('EU','Germany','Munich'),('EU','France','Paris'),('EU','France','Lyon'), ('Americas','USA','New York'),('Americas','USA','Chicago'),('Americas','Canada','Toronto'), ('APAC','Japan','Tokyo'),('APAC','Japan','Osaka'),('APAC','Australia','Sydney')) t(region, country, city);CREATE TABLE orders ASSELECT DATE '2026-01-05' + (7 * w)::INT AS week, g.region, g.country, g.city, c.channel, (abs(hash(g.city || c.channel || w)) % 60 + 20 + 2 * w) AS revenueFROM geo g, (VALUES ('web'), ('app'), ('store')) c(channel), range(26) r(w);SELECT 2::COLUMNS;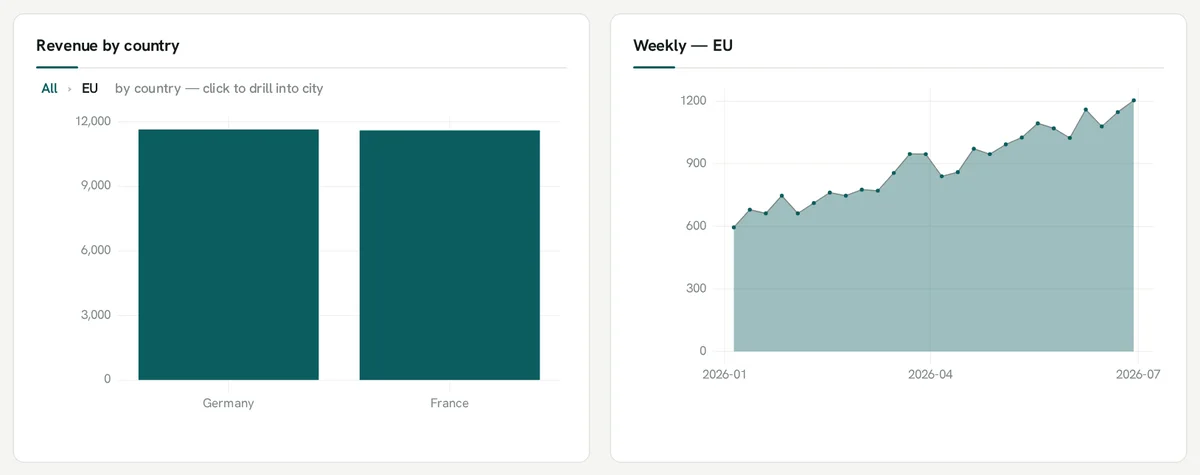
Drill-down
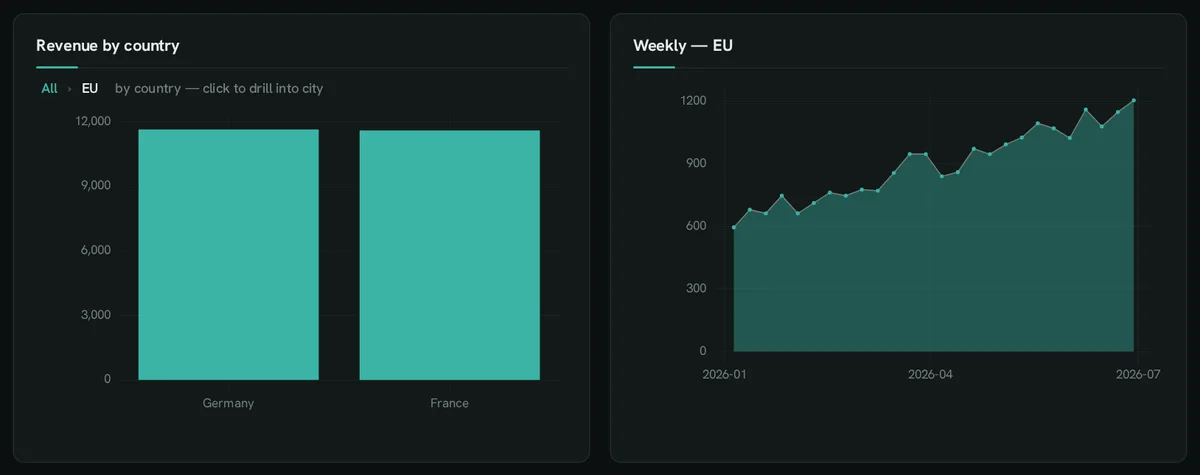
Section titled “Drill-down”::DRILL walks a hierarchy on a click — here after a click on EU; a breadcrumb leads back.
SELECT 'region > country > city'::DRILL;SELECT CASE getvariable('drill_level') WHEN 'region' THEN region WHEN 'country' THEN country ELSE city END AS place ::XAXIS, sum(revenue) ::BARCHART, ('Revenue by ' || getvariable('drill_level'))::TITLEFROM orders WHERE getvariable('region') IN ('', region) AND getvariable('country') IN ('', country)GROUP BY 1 ORDER BY 2 DESC;SELECT week ::XAXIS, sum(revenue) ::AREACHART, ('Weekly — ' || coalesce(nullif(getvariable('region'), ''), 'all regions'))::TITLEFROM orders WHERE getvariable('region') IN ('', region) AND getvariable('country') IN ('', country) GROUP BY 1 ORDER BY 1;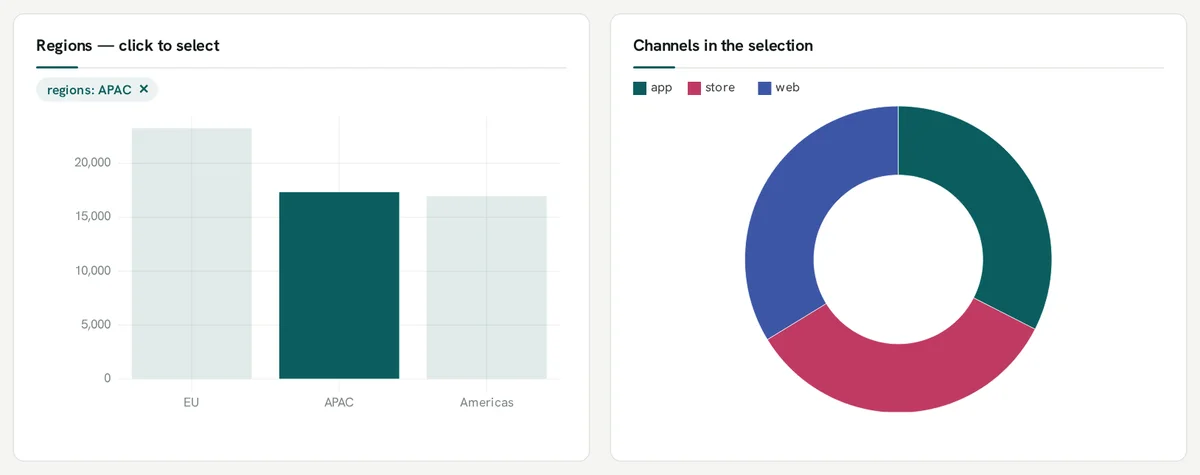
Named selections
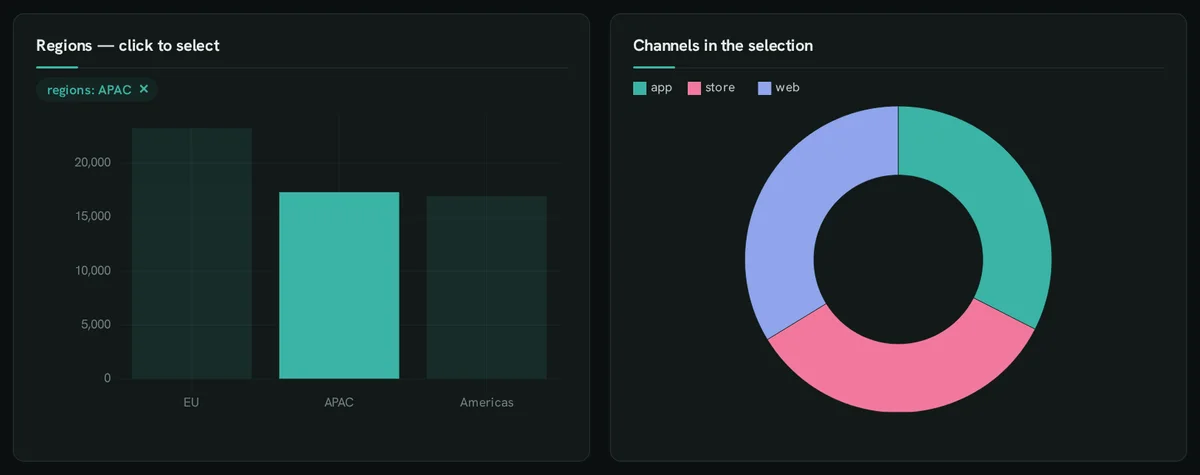
Section titled “Named selections”::SELECT_AS makes a click set a variable of its own; selections combine.
SELECT 'regions multi'::SELECT_AS;SELECT region ::XAXIS, sum(revenue) ::BARCHART, 'Regions — click to select'::TITLE FROM orders GROUP BY 1 ORDER BY 2 DESC;SELECT channel ::CATEGORY, sum(revenue) ::DONUTCHART, 'Channels in the selection'::TITLE FROM ordersWHERE len(getvariable('regions')) = 0 OR list_contains(getvariable('regions'), region) GROUP BY 1 ORDER BY 2 DESC;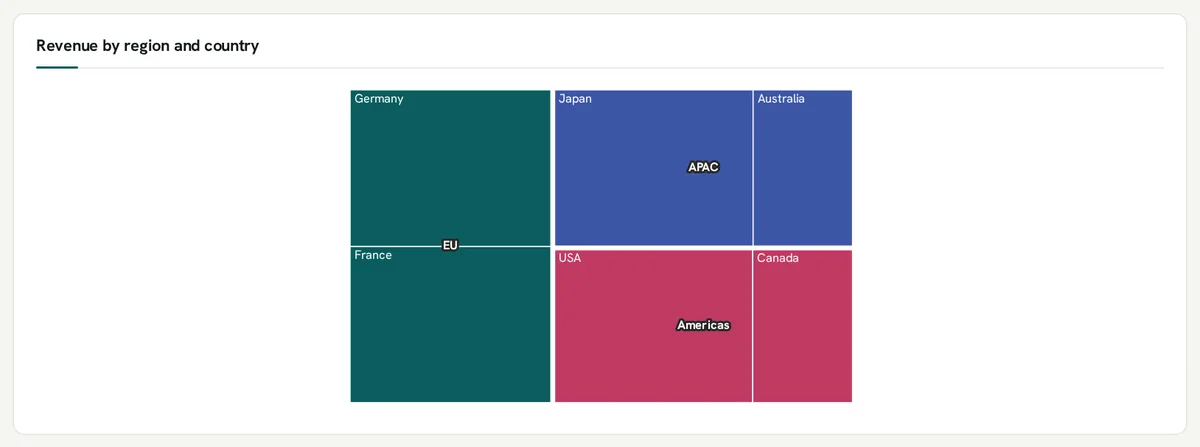
Treemap
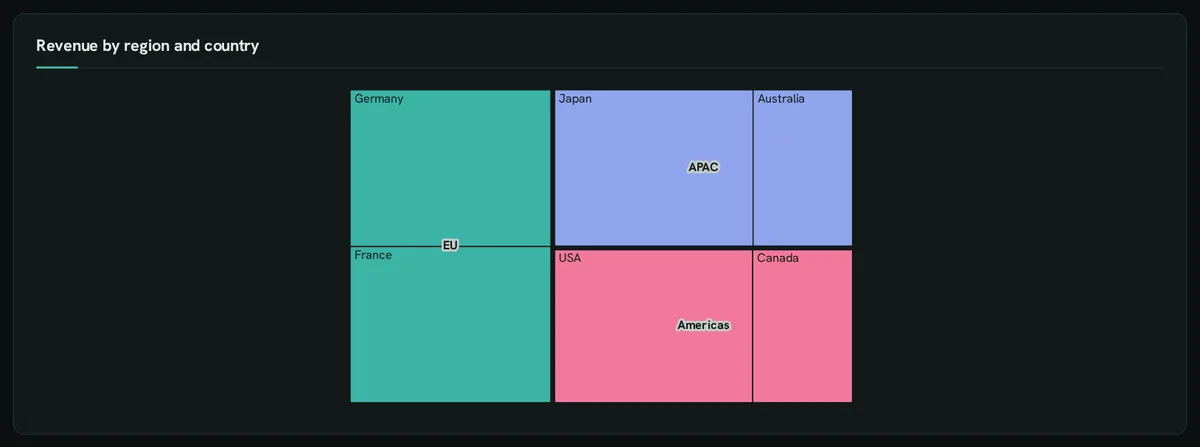
Section titled “Treemap”Part-to-whole tiles nested by ::CATEGORY; with a ::DRILL they drill like bars.
SELECT 12::COL;SELECT country ::XAXIS, region ::CATEGORY, sum(revenue) ::TREEMAP, 'Revenue by region and country'::TITLE FROM orders GROUP BY ALL;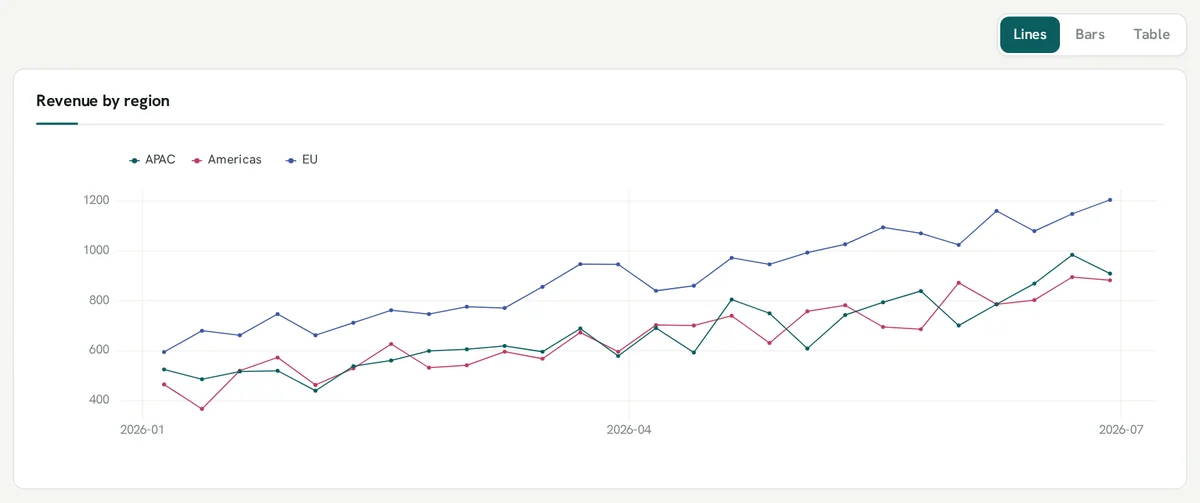
Alternative views
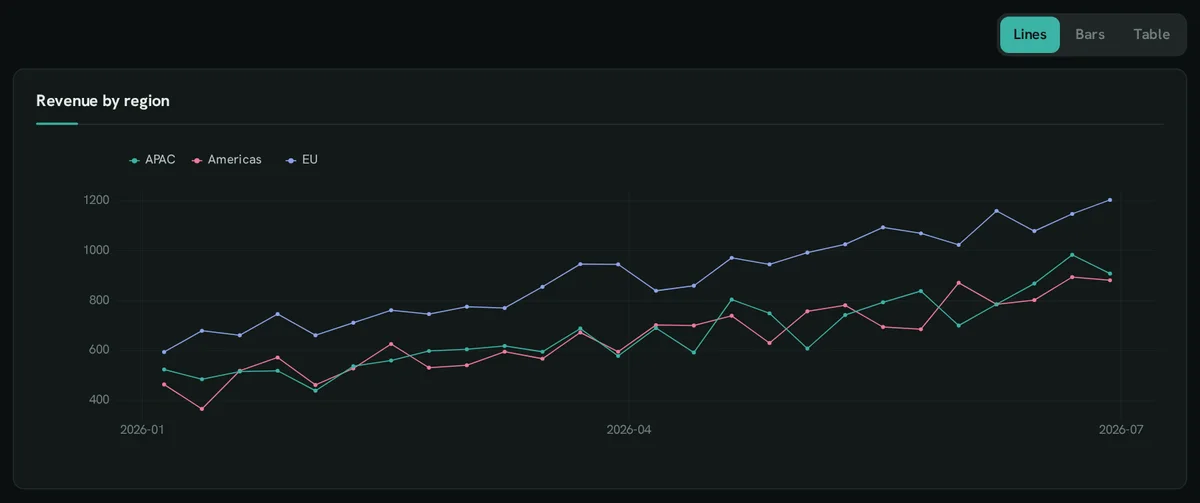
Section titled “Alternative views”Consecutive ::VIEW sections share a switcher: the same numbers as lines, bars or a table.
SELECT 12::COL;SELECT 'Lines' AS shape ::VIEW;SELECT week ::XAXIS, region ::CATEGORY, sum(revenue) ::LINECHART, 'Revenue by region'::TITLE FROM orders GROUP BY ALL ORDER BY 1;SELECT 'Bars' ::VIEW;SELECT week ::XAXIS, region ::CATEGORY, sum(revenue) ::BARCHART_STACKED, 'Revenue by region'::TITLE FROM orders GROUP BY ALL ORDER BY 1;SELECT 'Table' ::VIEW;SELECT region ::TABLE, sum(revenue) AS "Revenue" ::MONEY FROM orders GROUP BY 1 ORDER BY 2 DESC;SELECT 1::ENDVIEW;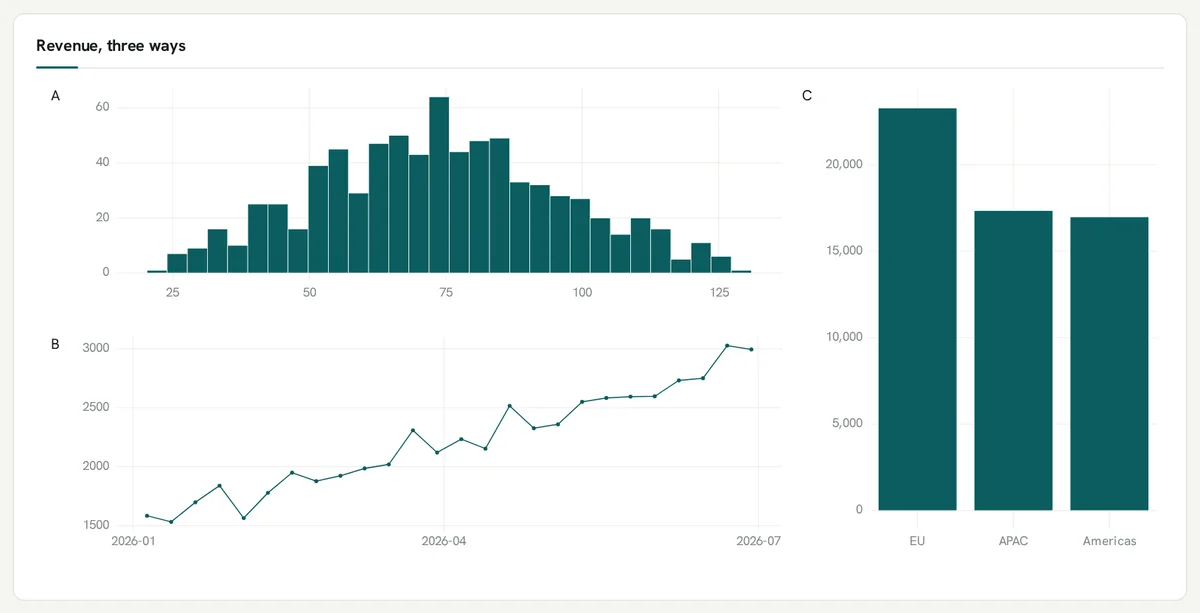
A composed figure
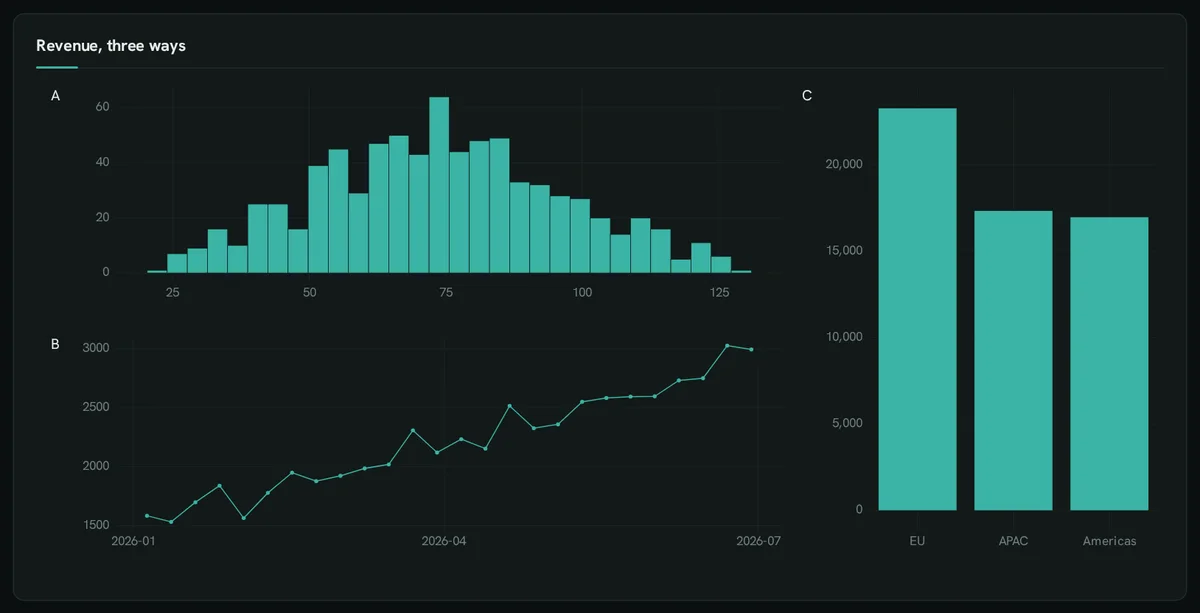
Section titled “A composed figure”::FIGURE lays several charts out as one picture with aligned axes and panel tags.
SELECT 12::COL;SELECT 'Revenue, three ways' ::FIGURE, '(hist / weekly) | regions' ::LAYOUT, '2,1' ::WIDTHS, 'A' ::TAG_LEVELS;-- @name histSELECT revenue ::HISTOGRAM FROM orders;-- @name weeklySELECT week ::XAXIS, sum(revenue) ::LINECHART FROM orders GROUP BY 1 ORDER BY 1;-- @name regionsSELECT region ::XAXIS, sum(revenue) ::BARCHART FROM orders GROUP BY 1 ORDER BY 2 DESC;SELECT 1 ::ENDFIGURE;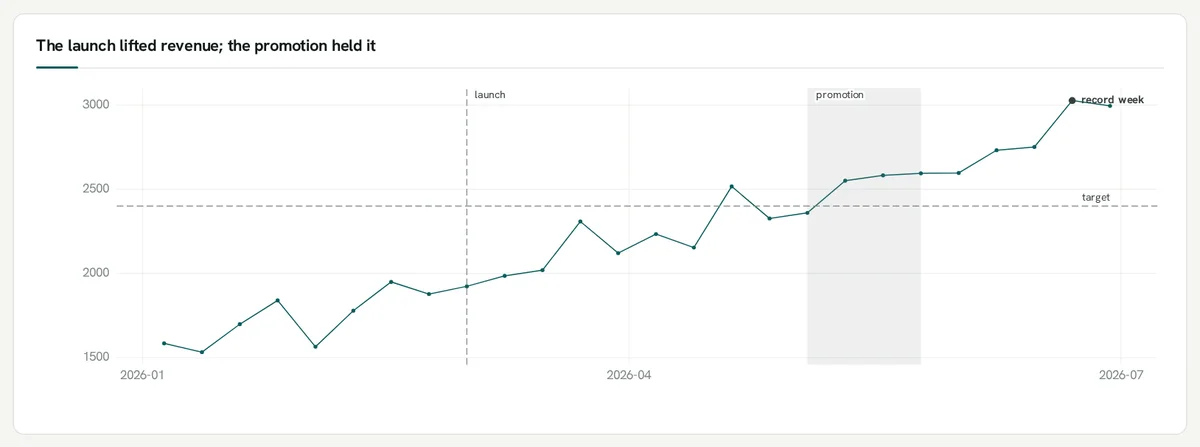
Annotations from data
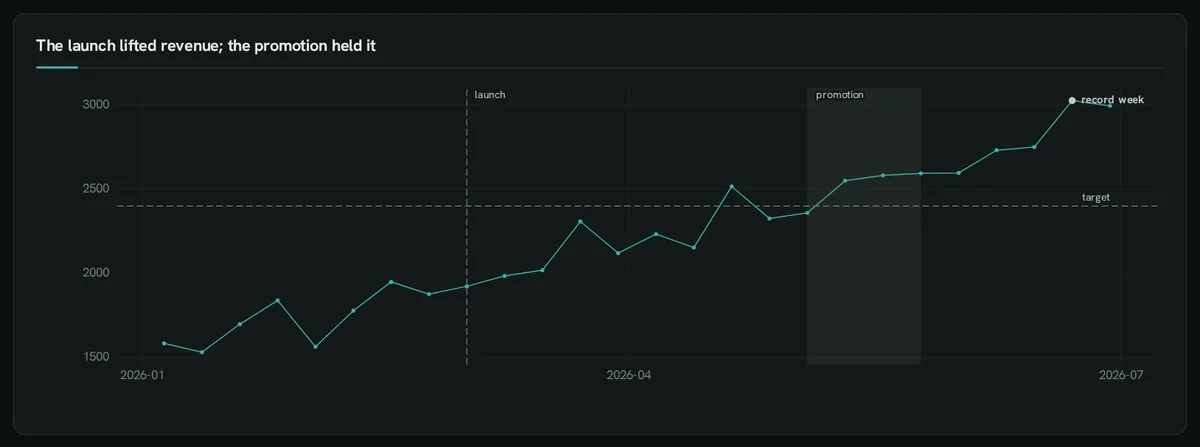
Section titled “Annotations from data”Event lines, shaded ranges, callouts and a target line, read per row from SQL.
SELECT 12::COL;SELECT week ::XAXIS, sum(revenue) ::LINECHART, CASE WHEN week = DATE '2026-03-02' THEN week END ::XLINE, CASE WHEN week = DATE '2026-03-02' THEN 'launch' END ::XLINE_LABEL, CASE WHEN week = DATE '2026-05-04' THEN week END ::XBAND_FROM, CASE WHEN week = DATE '2026-05-04' THEN DATE '2026-05-25' END ::XBAND_TO, CASE WHEN week = DATE '2026-05-04' THEN 'promotion' END ::XBAND_LABEL, CASE WHEN sum(revenue) = max(sum(revenue)) OVER () THEN 'record week' END ::ANNOTATE, 2400 ::REFLINE, 'target' ::REFLINE_LABEL, 'The launch lifted revenue; the promotion held it'::TITLEFROM orders GROUP BY week ORDER BY week;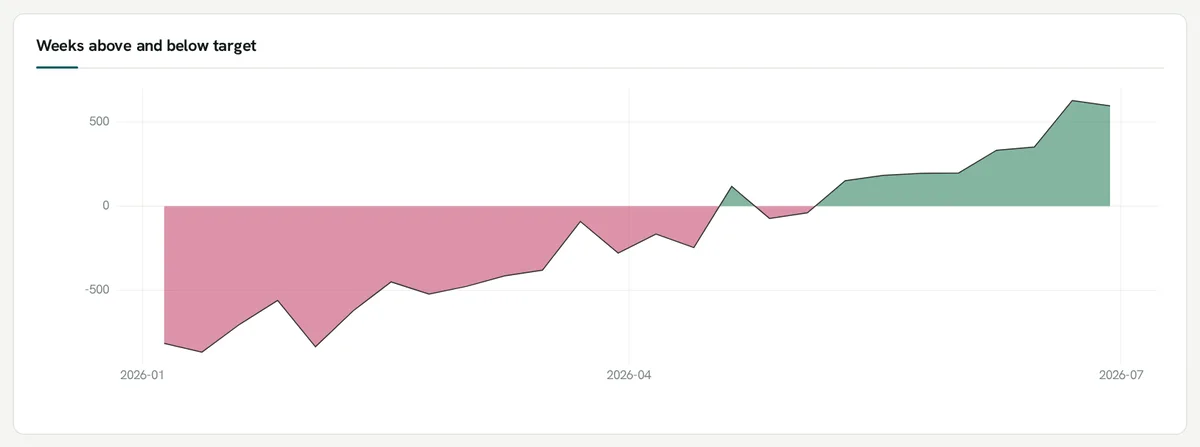
Above and below a line
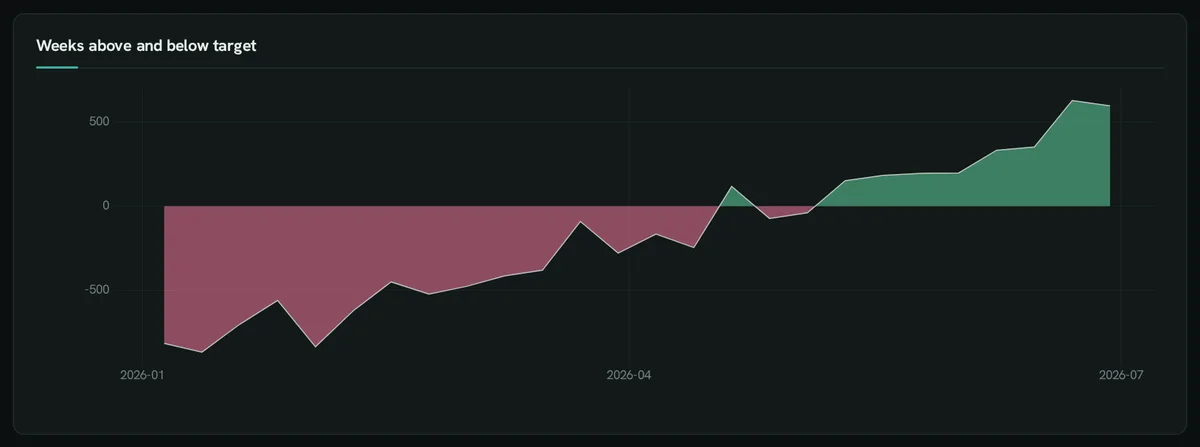
Section titled “Above and below a line”::SIGN_SPLIT colours one line, area or density red below a threshold and green above, cut exactly where it crosses — gains and losses, above or below a target.
SELECT 12::COL;SELECT week ::XAXIS, sum(revenue) - 2400 AS "Revenue against the 2,400 target" ::AREACHART, 0 ::SIGN_SPLIT, 'Weeks above and below target'::TITLEFROM orders GROUP BY week ORDER BY week;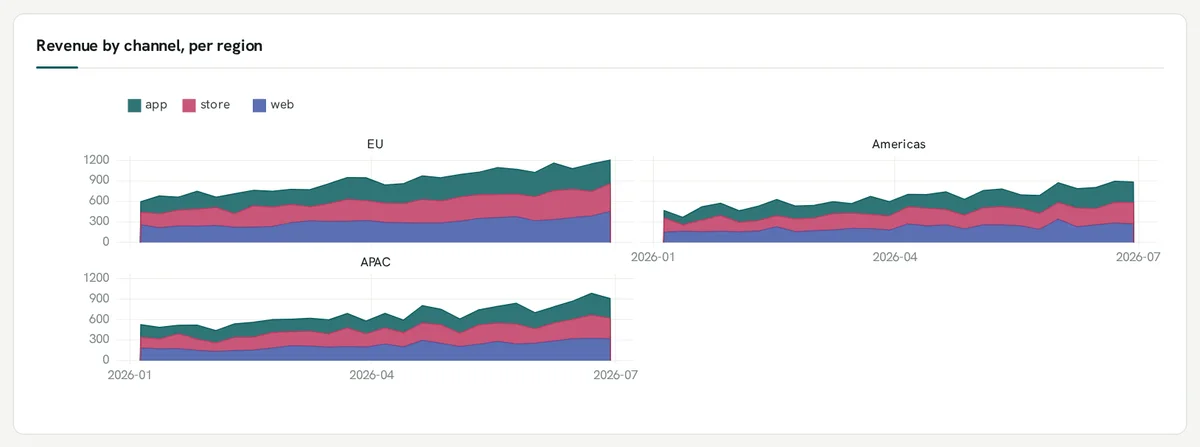
Small multiples
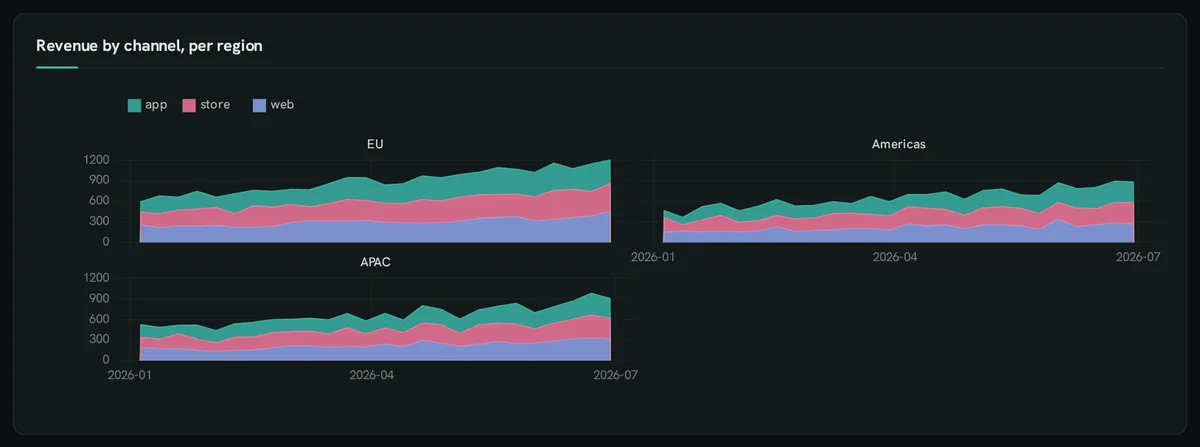
Section titled “Small multiples”::FACET draws one panel per value on shared axes.
SELECT 12::COL;SELECT week ::XAXIS, channel ::CATEGORY, sum(revenue) ::AREACHART_STACKED, region ::FACET, 'Revenue by channel, per region'::TITLEFROM orders GROUP BY ALL ORDER BY 1;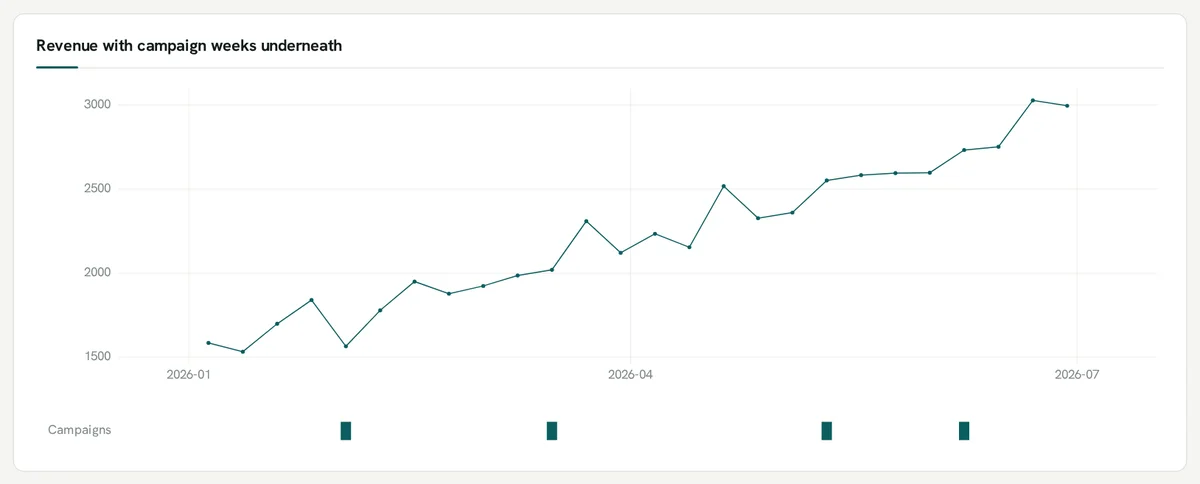
A strip under a chart
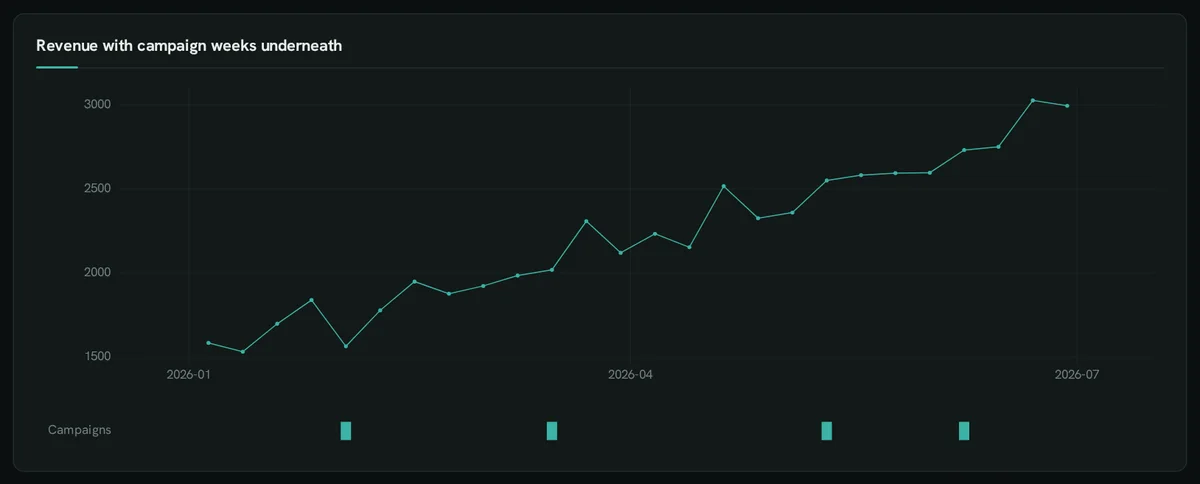
Section titled “A strip under a chart”::TRACK draws ticks, lanes or a small line under the chart above, on its x axis.
SELECT 12::COL;SELECT week ::XAXIS, sum(revenue) ::LINECHART, 'Revenue with campaign weeks underneath'::TITLE FROM orders GROUP BY 1 ORDER BY 1;SELECT week ::XAXIS, 'Campaigns' ::TRACK, 'campaign' ::LABEL FROM orders WHERE week IN (DATE '2026-02-02', DATE '2026-03-16', DATE '2026-05-11', DATE '2026-06-08') GROUP BY 1;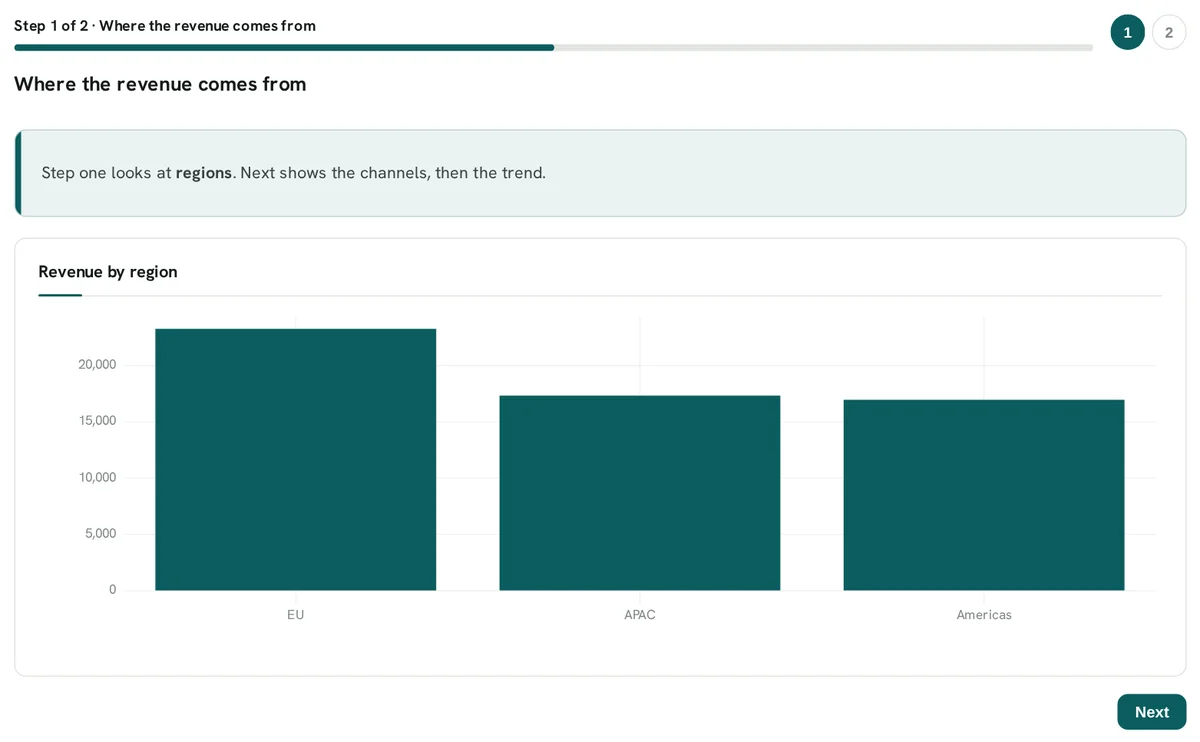
Guided steps
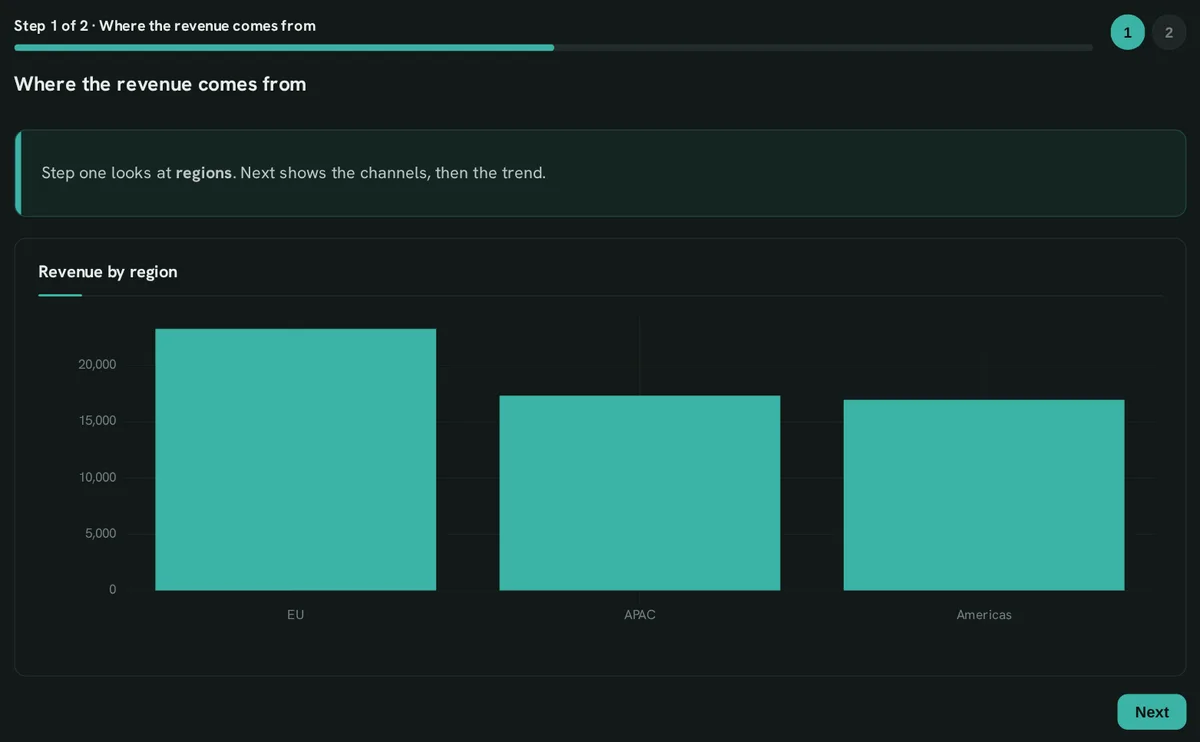
Section titled “Guided steps”::GUIDE_STEP turns sections into a sequence with Back / Next — onboarding, tutorials, wizards.
SELECT 12::COL;SELECT 'Where the revenue comes from' AS tour ::GUIDE_STEP;SELECT 'Step one looks at **regions**. Next shows the channels, then the trend.'::MARKDOWN;SELECT region ::XAXIS, sum(revenue) ::BARCHART, 'Revenue by region'::TITLE FROM orders GROUP BY 1 ORDER BY 2 DESC;SELECT 'Channels' ::GUIDE_STEP;SELECT channel ::XAXIS, sum(revenue) ::BARCHART FROM orders GROUP BY 1 ORDER BY 2 DESC;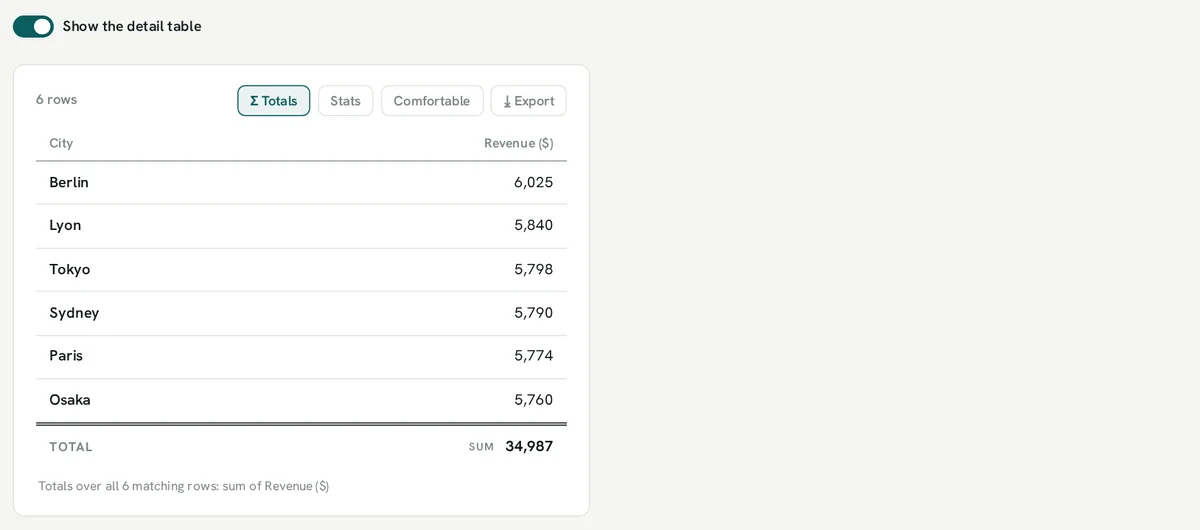
Show a panel only when …
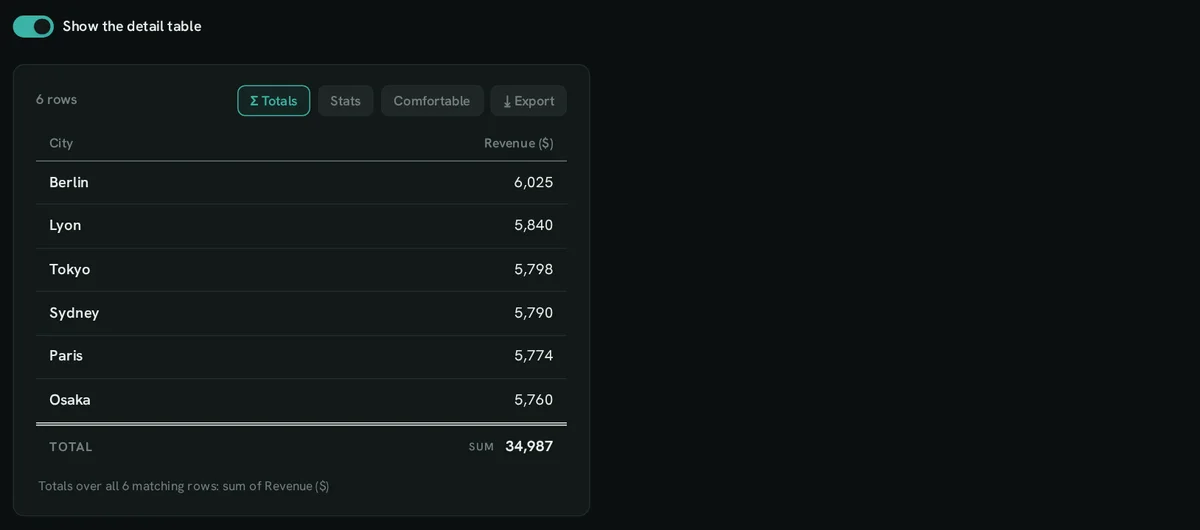
Section titled “Show a panel only when …”::SHOW_IF hides the next panel until a condition holds — here a toggle.
SELECT true AS details ::TOGGLE, 'Show the detail table'::LABEL;SELECT getvariable('details') ::SHOW_IF;SELECT city ::TABLE, sum(revenue) AS "Revenue" ::MONEY FROM orders GROUP BY 1 ORDER BY 2 DESC LIMIT 6;

Text with live values
Section titled “Text with live values”::MARKDOWN fills {{col:fmt}} from its own row, renders formulas and callouts.
SELECT 12::COL;SELECT 'Revenue so far is **{{total:money}}**, {{share:percent}} of it from the web. Growth follows $r_t = \frac{y_t}{y_{t-1}} - 1$.' ::MARKDOWN, 'note' ::CALLOUT, sum(revenue) AS total, round(100 * sum(revenue) FILTER (WHERE channel = 'web') / sum(revenue), 1) AS share FROM orders;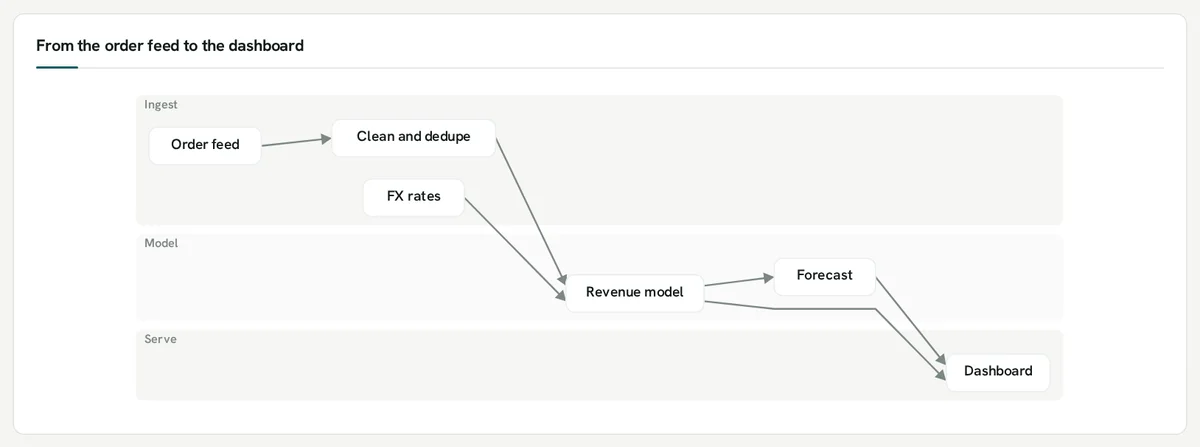
A process diagram
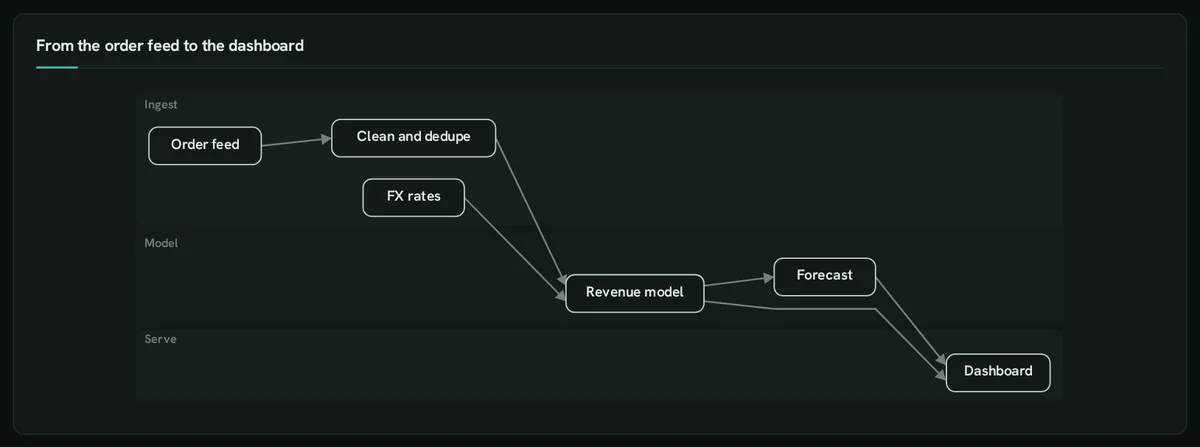
Section titled “A process diagram”::DIAGRAM draws nodes and edges from rows: a pipeline, a lineage, a process in swimlanes.
SELECT 12::COL;SELECT id ::DIAGRAM, label ::LABEL, up ::UPSTREAM, lane ::LANE, 'From the order feed to the dashboard'::TITLEFROM (VALUES ('feed', 'Order feed', []::VARCHAR[], 'Ingest'), ('clean', 'Clean and dedupe', ['feed'], 'Ingest'), ('fx', 'FX rates', []::VARCHAR[], 'Ingest'), ('model', 'Revenue model', ['clean', 'fx'], 'Model'), ('fc', 'Forecast', ['model'], 'Model'), ('dash', 'Dashboard', ['model', 'fc'], 'Serve')) t(id, label, up, lane);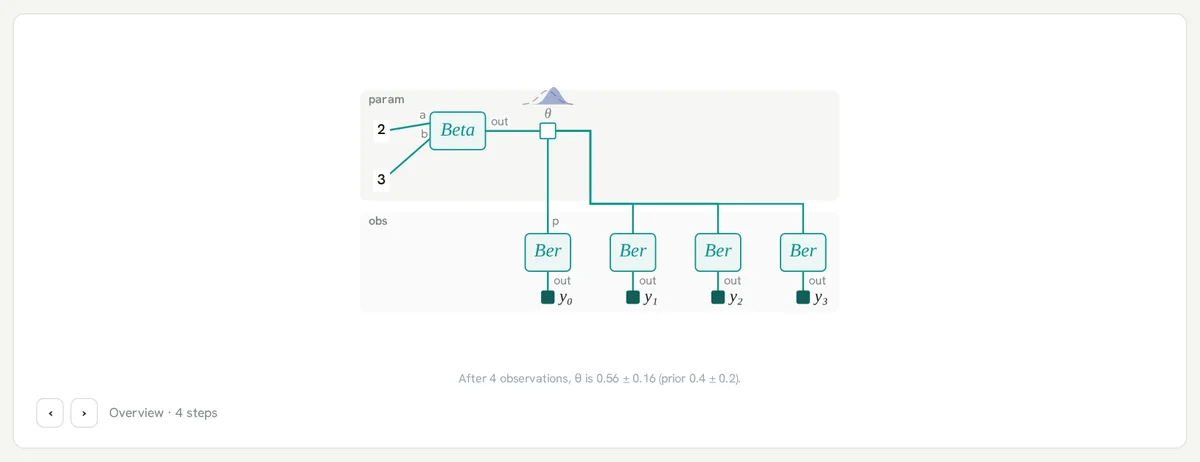
A factor graph
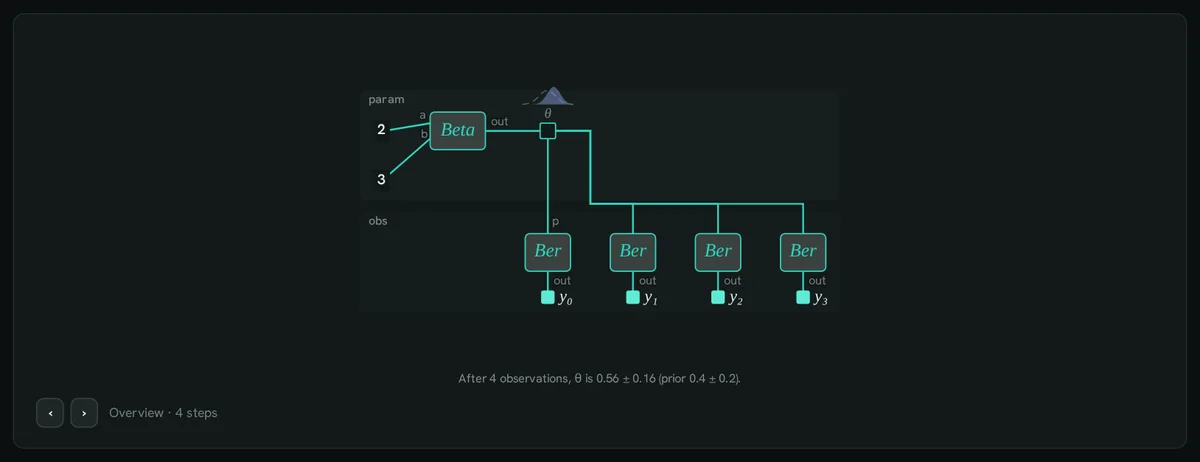
Section titled “A factor graph”anofox_plot_factor_graph draws a Bayesian model as a Forney-style factor graph — factors as boxes, variables as circles, observations filled — with what the model learned. Hover θ; Step walks the messages.
SELECT 'factor-graph'::REQUIRES;SELECT 12::COL;CREATE TABLE fg_nodes ASSELECT * FROM (VALUES ('th', 'variable', 'theta', '\theta', NULL, 'param', NULL), ('eq', 'equality', '=', '=', NULL, 'param', NULL), ('pr', 'factor', 'Beta', 'Beta', NULL, 'param', NULL), ('a', 'constant', '2', '2', NULL, 'param', NULL), ('b', 'constant', '3', '3', NULL, 'param', NULL)) t(id, kind, name, label, slice, layer, plate)UNION ALL SELECT 'y' || i, 'data', 'y[' || i || ']', 'y_{' || i || '}', i::VARCHAR, 'obs', 'y' FROM range(4) r(i)UNION ALL SELECT 'f' || i, 'factor', 'Bernoulli', 'Bernoulli', i::VARCHAR, 'obs', 'y' FROM range(4) r(i);CREATE TABLE fg_edges ASSELECT * FROM (VALUES ('th', 'eq', NULL, 0), ('eq', 'pr', 'out', 0), ('a', 'pr', 'a', 1), ('b', 'pr', 'b', 2)) t(variable, factor, interface, seq)UNION ALL SELECT 'y' || i, 'f' || i, 'out', 0 FROM range(4) r(i)UNION ALL SELECT 'eq', 'f' || i, 'p', 1 FROM range(4) r(i);-- θ ~ Beta(2, 3); three of four returns defective → Beta(5, 4)SELECT anofox_plot_factor_graph(n, edges := (SELECT list(e) FROM fg_edges e), marginals := [{'variable': 'th', 'iteration': 1, 'mean': 5 / 9, 'sd': 0.1571, 'family': 'Beta'}], schedule := (SELECT list({'iteration': 1, 'step': i + 1, 'variable': 'eq', 'factor': f, 'interface': 'p', 'direction': 'to_variable'}) FROM (SELECT 'pr' AS f, 0 AS i UNION ALL SELECT 'f' || i, i + 1 FROM range(4) r(i)))) AS "What share of returned units is defective?"FROM fg_nodes n;