
::VIOLIN
Dashboards: browser · CLI · servers
Community extension: anofox_render
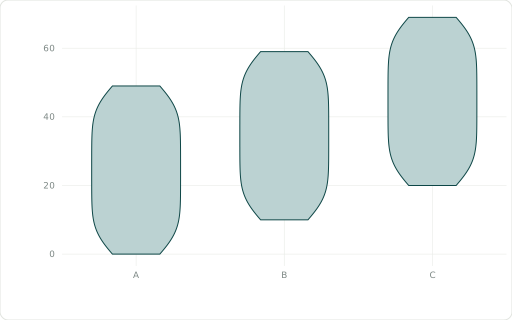
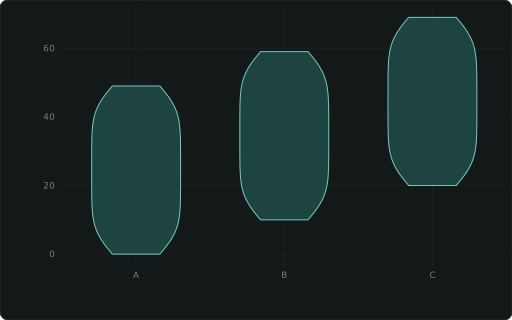
Violin plot — XAXIS groups, measure on y (raw rows).
Also spelled: ::VIOLINPLOT
The data it needs
Section titled “The data it needs”As ::BOXPLOT: raw rows, ::XAXIS groups, the measure as y.
SELECT ['A','B','C'][1 + i % 3] ::XAXIS, (i * 7919) % 50 + (i % 3) * 10 ::VIOLIN FROM range(0, 150) r(i);In an example
Section titled “In an example”From Which chart fits which question? — open it in the builder ↗:
SELECT 6::COL; SELECT channel::XAXIS, value::VIOLIN, 'Violin'::TITLE FROM mRelated
Section titled “Related”::HISTOGRAM · ::DENSITY · ::RIDGELINE · ::BOXPLOT · ::QQ