
::DENSITY
Dashboards: browser · CLI · servers
Community extension: anofox_render
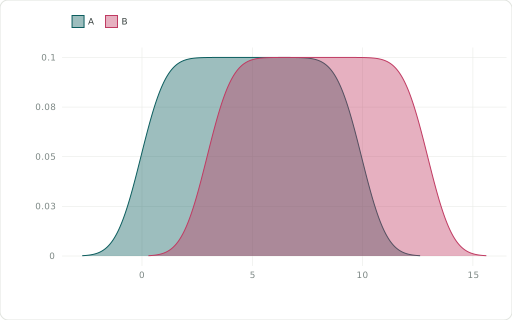
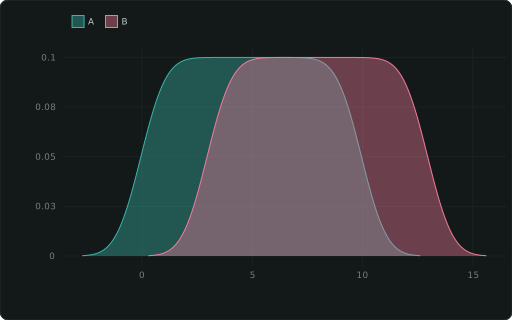
Kernel density curve (one per CATEGORY).
Also spelled: ::KDE
The data it needs
Section titled “The data it needs”Raw rows: one per observation; ::CATEGORY draws one curve per group.
SELECT g ::CATEGORY, (i * 7919) % 100 / 10.0 + (g = 'B')::INT * 3 ::DENSITYFROM range(0, 200) r(i), (VALUES ('A'), ('B')) c(g);In an example
Section titled “In an example”From Which chart fits which question? — open it in the builder ↗:
SELECT 6::COL; SELECT value::DENSITY, channel::CATEGORY, 'Density by channel'::TITLE FROM mAlso in: Can a model triage the support inbox?
Related
Section titled “Related”::HISTOGRAM · ::RIDGELINE · ::BOXPLOT · ::VIOLIN · ::QQ