
What anofox-forecast draws
Each picture is one anofox_plot(...) call on a result table of anofox-forecast, drawn in CI on every push from the extension’s latest build. Install and use it →
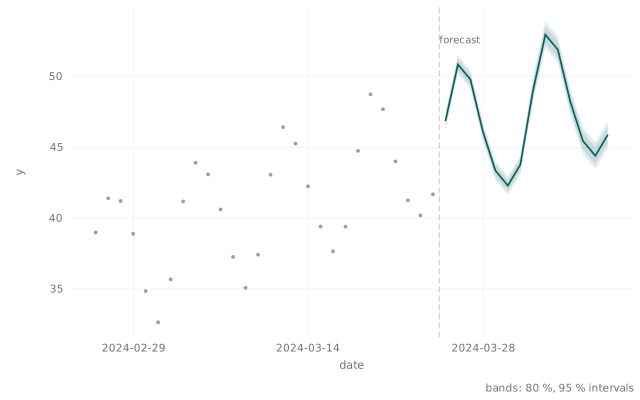
A forecast fan
Section titled “A forecast fan”History, the forecast and nested 80 % / 95 % intervals from the forecast start.
anofox_plot_prediction · ts_forecast_by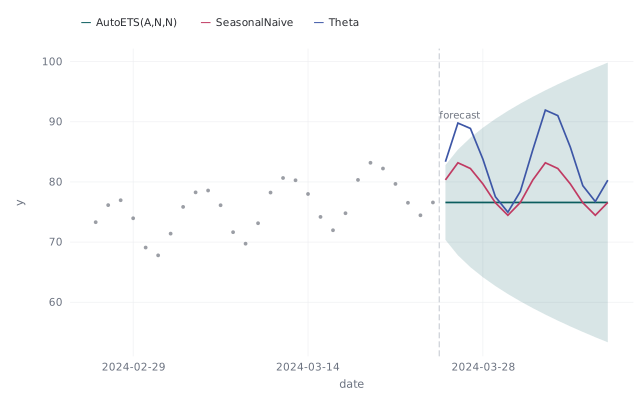
Several methods
Section titled “Several methods”One line per method beside the reference method’s band.
anofox_plot_prediction · ts_forecast_by × 3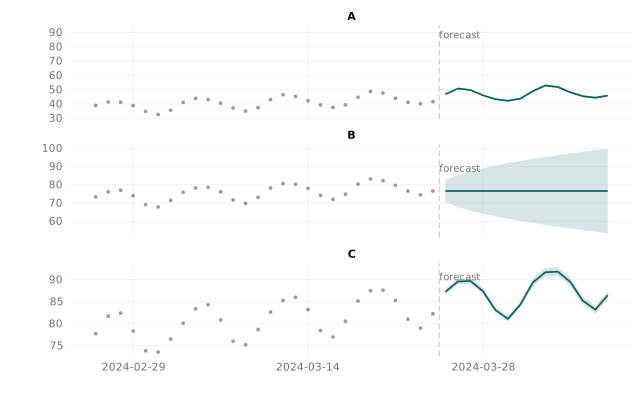
One panel per series
Section titled “One panel per series”Forecasts for every series of a panel, each with its history.
anofox_plot_prediction · ts_forecast_by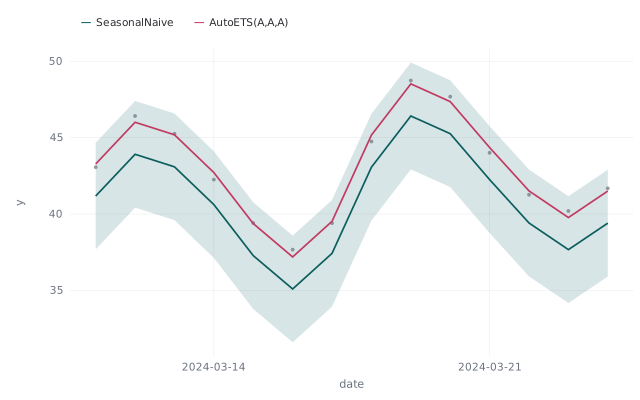
Backtest
Section titled “Backtest”Two methods’ backtest forecasts against the actuals.
anofox_plot_prediction · ts_cv_forecast_by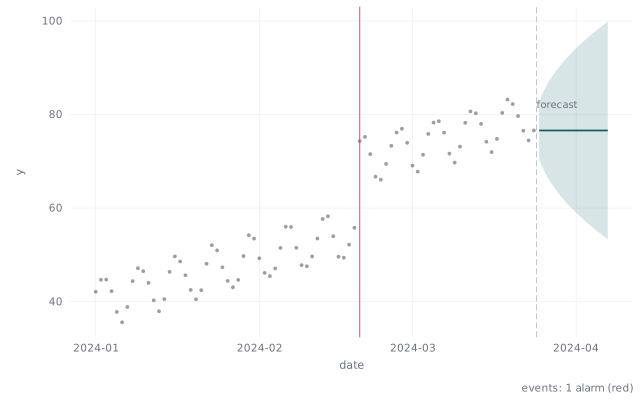
Changepoints
Section titled “Changepoints”Detected changepoints as events over the history and the forecast.
anofox_plot_prediction · ts_detect_changepoints_by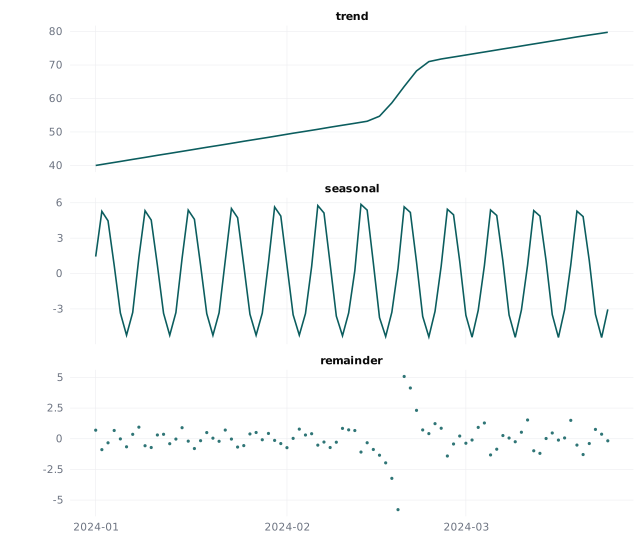
Decomposition
Section titled “Decomposition”Trend, seasonal and remainder as stacked panels on one time axis.
anofox_plot_decomposition · ts_mstl_decomposition_long_by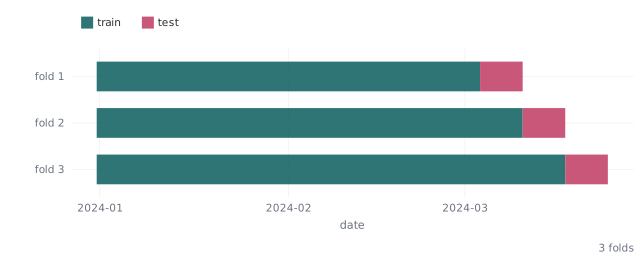
Cross-validation folds
Section titled “Cross-validation folds”Train and test windows per fold.
anofox_plot_cv · ts_cv_folds_by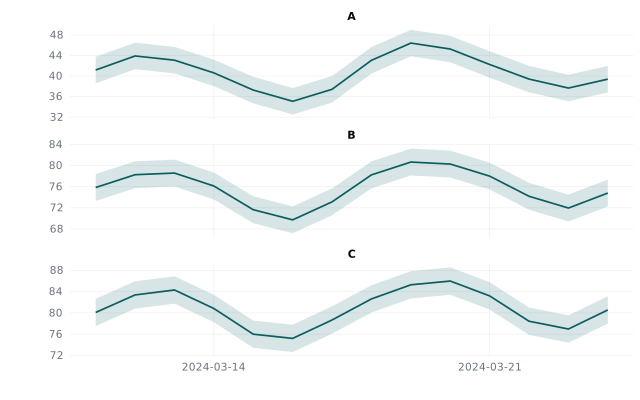
Conformal intervals
Section titled “Conformal intervals”Forecasts with calibrated conformal bands, one panel per series.
anofox_plot_prediction · ts_conformal_by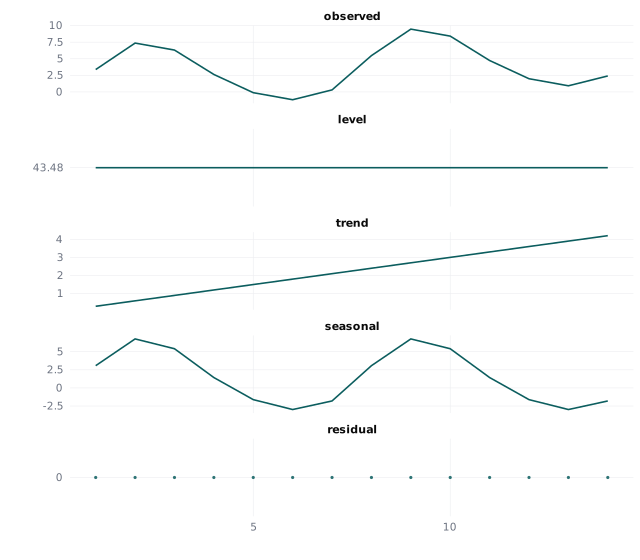
What the model sees
Section titled “What the model sees”Observed, level, trend, seasonal and residual of a fitted model.
anofox_plot_decomposition · ts_forecast_explain_by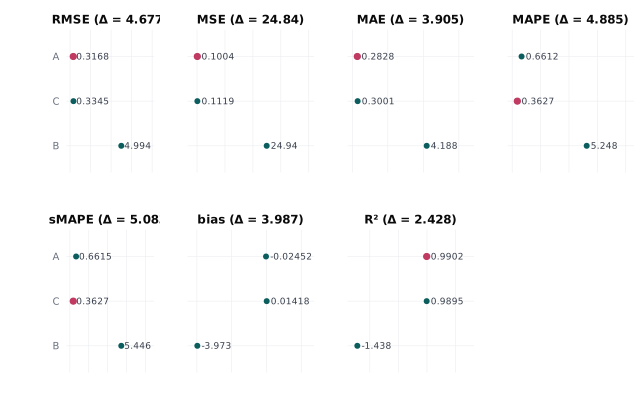
Accuracy metrics
Section titled “Accuracy metrics”RMSE, MAE, MAPE, bias and more per series, one panel per metric.
anofox_plot_summary · ts_metrics_by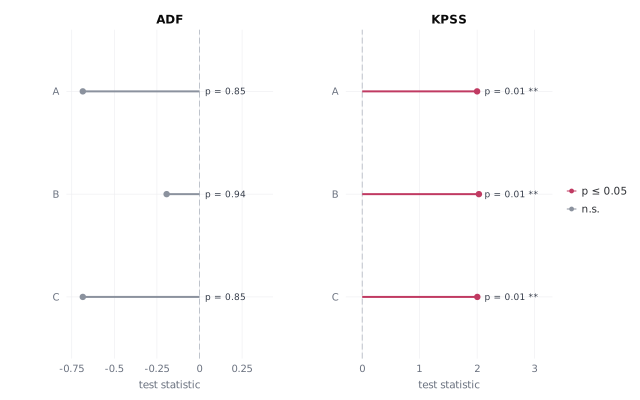
Stationarity tests
Section titled “Stationarity tests”ADF and KPSS per series, each on its own scale, coloured by significance.
anofox_plot_tests · ts_adf_by ∪ ts_kpss_by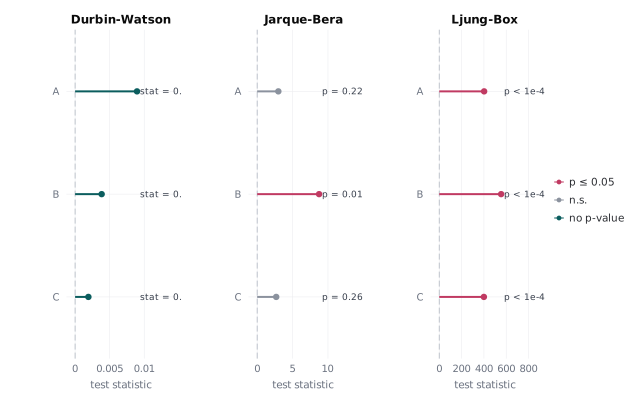
Residual diagnostics
Section titled “Residual diagnostics”Durbin–Watson, Jarque–Bera and Ljung–Box per series.
anofox_plot_tests · ts_residual_diagnostics_by