
KPIs
A KPI is one statement with a value column; more columns of the same statement add the change, a trend, a goal and status colours.
The sample data every tile on this page uses
CREATE TABLE daily ASSELECT DATE '2026-09-01' + INTERVAL (d) DAY AS day, round(9000 + 40 * d + 900 * sin(d / 3.0)) AS revenue, 120 + (d * 7) % 23 AS ticketsFROM range(0, 60) r(d);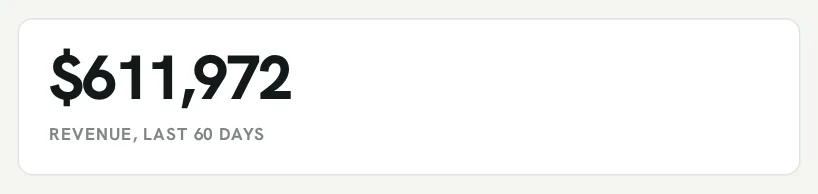
A number and a caption
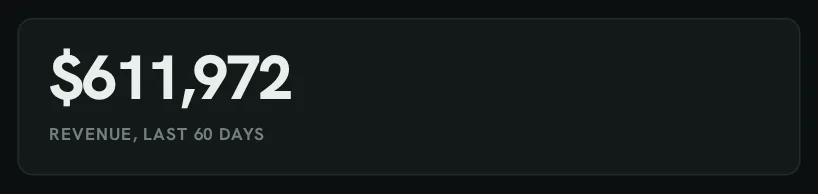
Section titled “A number and a caption”::METRIC, ::MONEY, ::PERCENT or ::COMPACT for the value, ::LABEL for the caption.
SELECT sum(revenue) ::MONEY, 'Revenue, last 60 days'::LABEL FROM daily;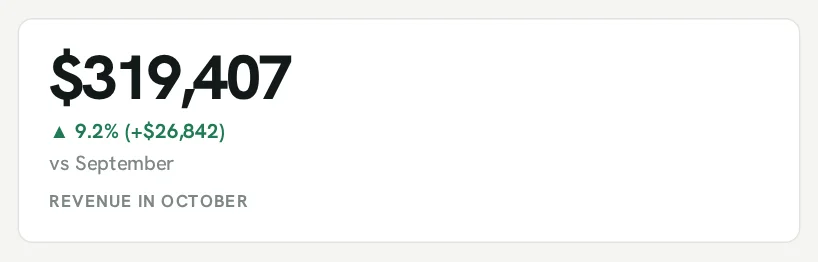
Change against a period
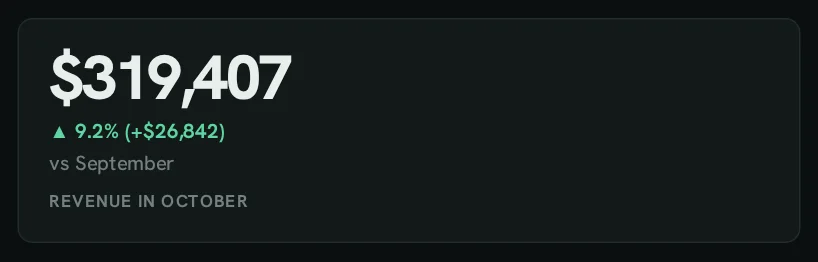
Section titled “Change against a period”::DELTA is the comparison value: ▲ / ▼ and the change, green when it moves the good way.
SELECT sum(revenue) FILTER (WHERE day >= DATE '2026-10-01') ::MONEY, sum(revenue) FILTER (WHERE day < DATE '2026-10-01') ::DELTA, 'both'::DELTA_FORMAT, 'vs September'::DELTA_LABEL, 'Revenue in October'::LABEL FROM daily;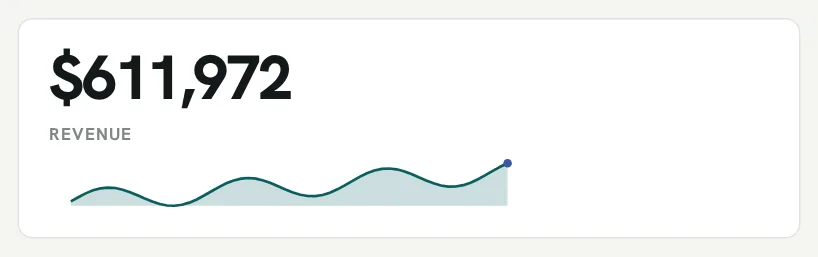
A trend line
Section titled “A trend line”::SPARKLINE takes a list() — the last point is marked.
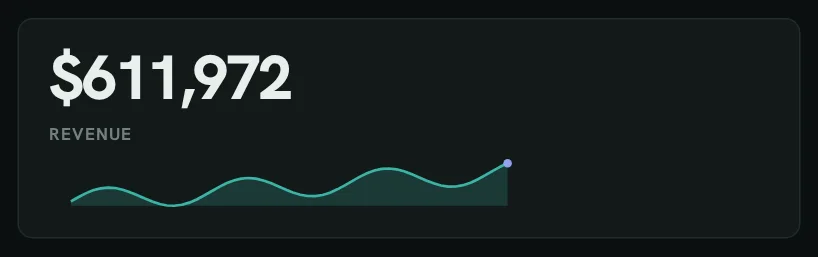
SELECT sum(revenue) ::MONEY, list(revenue ORDER BY day) ::SPARKLINE, 'Revenue'::LABEL FROM daily;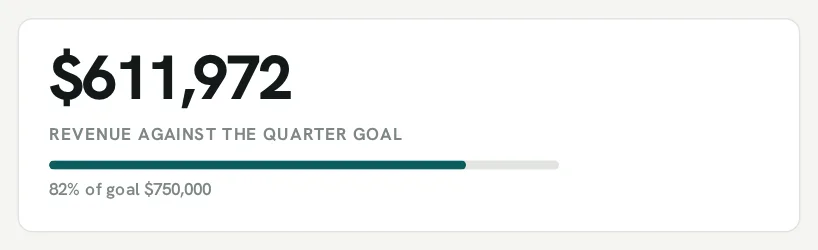
Progress to a goal
Section titled “Progress to a goal”::GOAL draws a progress bar and says how far it is.
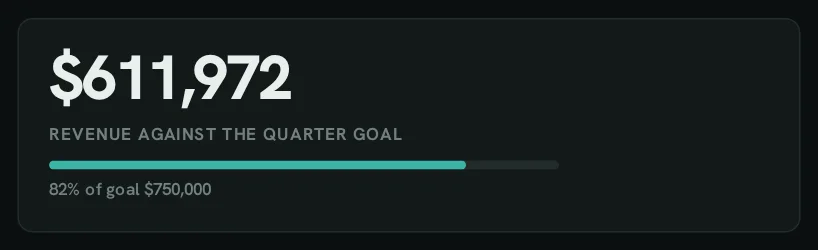
SELECT sum(revenue) ::MONEY, 750000 ::GOAL, 'Revenue against the quarter goal'::LABEL FROM daily;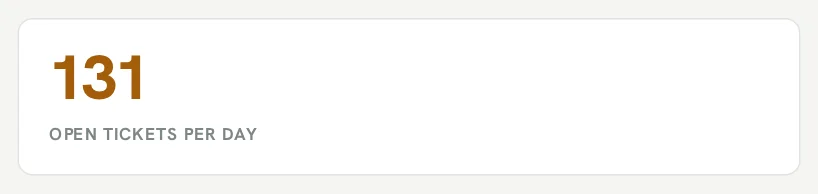
Status colours
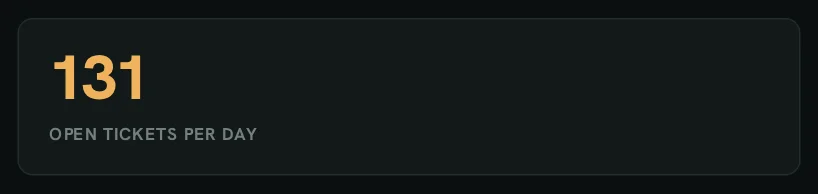
Section titled “Status colours”::THRESHOLDS colours the value by rules — here fewer tickets are better.
SELECT avg(tickets)::INT ::METRIC, '<130:good; <140:warn; bad'::THRESHOLDS, 'Open tickets per day'::LABEL FROM daily;

A KPI strip
Section titled “A KPI strip”Tiles in a ::GROUP box share one row.
SELECT 'Headline'::GROUP;SELECT sum(revenue) ::MONEY, 'Revenue'::LABEL FROM daily;SELECT sum(tickets) ::COMPACT, 'Tickets'::LABEL FROM daily;SELECT 96.4 ::PERCENT, 'Answered in time'::LABEL, '>=95:good; >=90:warn; bad'::THRESHOLDS;SELECT 4.6 ::METRIC, 'Satisfaction (of 5)'::LABEL;SELECT 1::ENDGROUP;

A compact status row
Section titled “A compact status row”'compact'::KPI_SIZE packs the tiles onto one line.
SELECT 'Status'::GROUP, 'compact'::KPI_SIZE;SELECT 42 ::METRIC, 'Open orders'::LABEL;SELECT 3 ::METRIC, 'Alerts'::LABEL, '<1:good; <4:warn; bad'::THRESHOLDS;SELECT 99.2 ::PERCENT, 'Uptime'::LABEL, '>=99:good; bad'::THRESHOLDS;SELECT 1::ENDGROUP;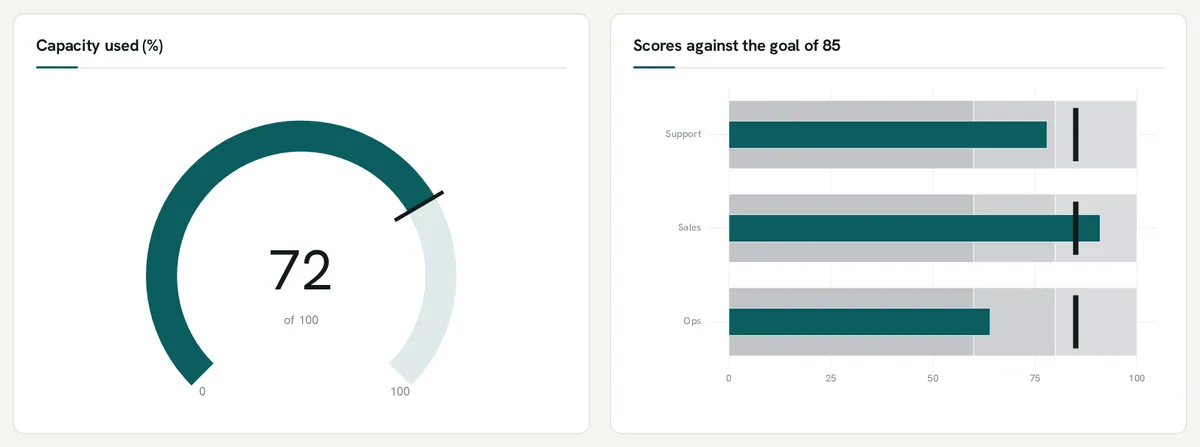
Gauge and bullet
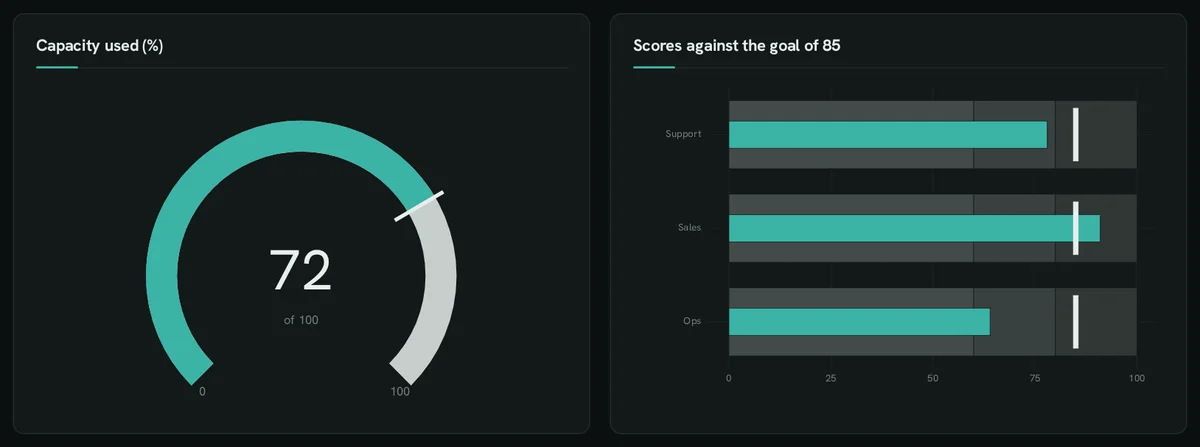
Section titled “Gauge and bullet”A value on an arc toward a range, or bars against a goal tick over bands.
SELECT 6::COL;SELECT 72 ::GAUGE, '0,100' ::RANGE, 'Capacity used (%)'::TITLE;SELECT 6::COL;SELECT team ::XAXIS, score ::BULLET, 85 ::GOAL, '60,80,100' ::RANGE, 'Scores against the goal of 85'::TITLEFROM (VALUES ('Support', 78), ('Sales', 91), ('Ops', 64)) t(team, score);