
::SCATTER
Dashboards: browser · CLI · servers
Community extension: anofox_render
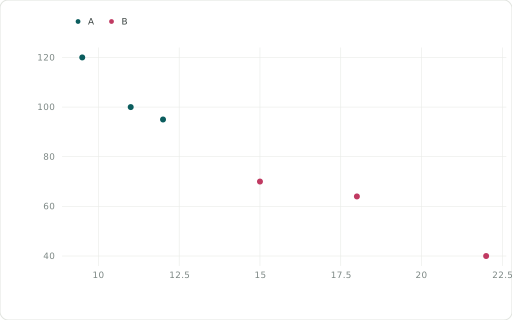
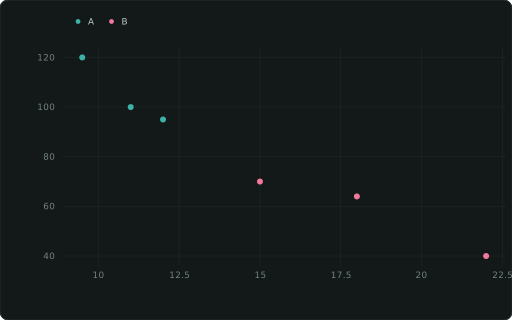
Scatter; add a ::SIZE column for a bubble chart.
Also spelled: ::POINT, ::SCATTERCHART
The data it needs
Section titled “The data it needs”One row per point: a numeric ::XAXIS and the measure as y. ::CATEGORY colours, ::SIZE makes it a bubble chart, ::LABEL names points.
SELECT price ::XAXIS, units ::SCATTER, segment ::CATEGORYFROM (VALUES (9.5,120,'A'),(12,95,'A'),(15,70,'B'),(18,64,'B'),(22,40,'B'),(11,100,'A')) t(price, units, segment);In an example
Section titled “In an example”From Can we build a dashboard without a data source? — open it in the builder ↗:
SELECT i::XAXIS, (sin(i/5.0)*25 + 50 + ((i*13) % 20))::SCATTER, 'Noisy samples'::TITLEFROM range(0, 120) t(i)Also in: Which chart fits which question? · Where will stock run short, and can we trust the plan? · How reliable are our suppliers, and what does it cost us in stock? · How do we plan a busy day at the distribution centre? · Which line runs which order, with the least changeover? · What sets the price of a home?