
::RADAR
Dashboards: browser · CLI · servers
Community extension: anofox_render
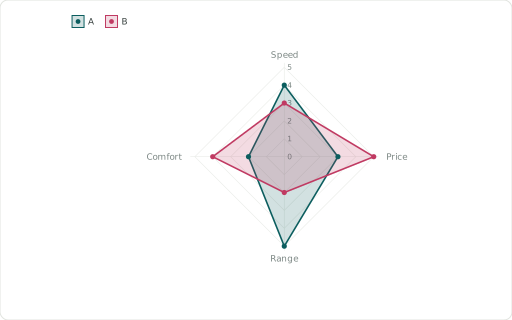
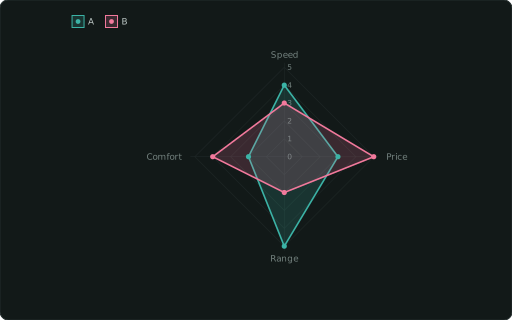
Radar / spider chart — axes from XAXIS, one polygon per CATEGORY.
Also spelled: ::SPIDER
The data it needs
Section titled “The data it needs”One row per axis and ::CATEGORY: ::XAXIS names the axis, each category is one polygon.
SELECT k ::XAXIS, p ::CATEGORY, s ::RADARFROM (VALUES ('Speed','A',4),('Price','A',3),('Range','A',5),('Comfort','A',2),('Speed','B',3),('Price','B',5),('Range','B',2),('Comfort','B',4)) t(k, p, s);In an example
Section titled “In an example”From Which chart fits which question? — open it in the builder ↗:
SELECT 6::COL; SELECT metric::XAXIS, score::RADAR, model::CATEGORY, 'Radar — model comparison'::TITLE FROM radarRelated
Section titled “Related”::PIE · ::DONUTCHART · ::GAUGE · ::SANKEY · ::TREEMAP