
KPIs and tables
KPI tiles
Section titled “KPI tiles”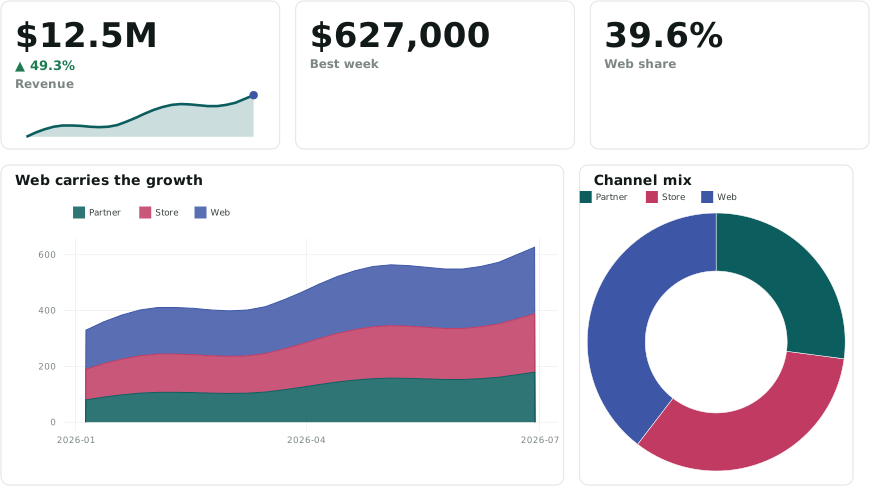
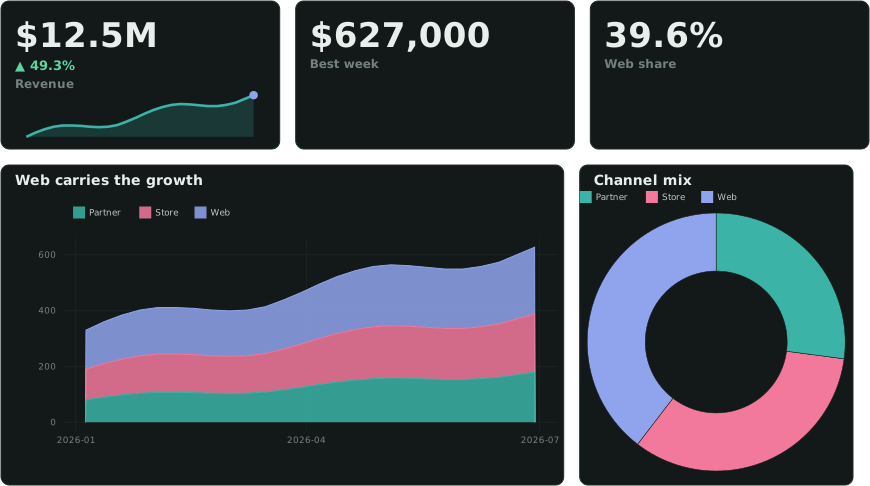
::GROUP box above two charts.A KPI is one statement with a ::METRIC, ::MONEY, ::PERCENT or ::COMPACT column. More columns in the same statement add to the tile:
| Column | Shows |
|---|---|
::LABEL |
the caption |
::DELTA (::DELTA_LOWER_GOOD) |
the comparison value: ▲/▼ and the change, green when it moves the good way |
::DELTA_FORMAT |
'pct' (default), 'abs' or 'both' |
::DELTA_LABEL |
what it compares against: 'vs last month' |
::SPARKLINE |
list(v ORDER BY d): a trend line under the caption |
::GOAL |
a progress bar toward the goal |
::THRESHOLDS |
colours the value: '<0:bad; <0.05:warn; good' |
SELECT 'Headline'::GROUP;SELECT sum(revenue) ::MONEY, sum(revenue_prev) ::DELTA, 'vs last month'::DELTA_LABEL, 'Revenue'::LABEL FROM kpi;SELECT round(100 * avg(on_time), 1) ::PERCENT, 'On time'::LABEL, '<90:bad; <95:warn; good'::THRESHOLDS FROM kpi;SELECT 1::ENDGROUP;Put a row of tiles in a ::GROUP box so they form one strip (design/ungrouped-kpis otherwise). 'compact'::KPI_SIZE packs a status row onto one line. Percent values are 0–100: 12.5 reads 12.5 %. KPI reference →
Tables
Section titled “Tables”::TABLE on the first column turns the whole result into a table. ::PAGED pages a large or remote result in SQL. Column roles format a column:
| Role | Formats |
|---|---|
::MONEY, ::PERCENT, ::COMPACT, ::METRIC |
number formats; a currency or K/M/B unit moves into the header |
::TREND |
a signed change, ▲ +2.7 / ▼ −3.1 |
::COLORSCALE |
a colour scale behind the cell |
::BADGE |
status pills |
::SPARKLINE, ::SPARKBAR |
a list() column drawn as a mini chart |
::PVALUE, ::SCIENTIFIC, ::PLAIN |
< 0.001; 1.23e−5; as written |
::LINK |
a link cell ('/d/orders?v.id={value}') |
SELECT store ::TABLE, revenue AS "Revenue" ::MONEY, growth AS "vs last year" ::TREND, status AS "Status" ::BADGE, weekly AS "Last 8 weeks" ::SPARKLINEFROM store_summary ORDER BY revenue DESC LIMIT 20;Every table has a toolbar with search, filters, totals (Σ), column stats, show/hide columns, and CSV / Excel export. Options for the next table are directives of their own: 'Revenue: sum; Share: none'::TOTALS, 'single'::ROWSELECT, 'Backtest: mae, rmse'::COLGROUP. Cut a long result to a top-N, or use ::PAGED: ::TABLE loads every row into the browser (design/raw-table). Table reference →
::MARKDOWN is a box of Markdown: lists, links, GFM tables, {{col:fmt}} values from its own row, $…$ formulas and images. ::INFO puts a definition behind an ⓘ on a panel’s title. ::CALLOUT and ::MARKDOWN_STYLE turn the box into a card or a callout. Markdown reference →