
::GAUGE
Dashboards: browser · CLI · servers
Community extension: anofox_render
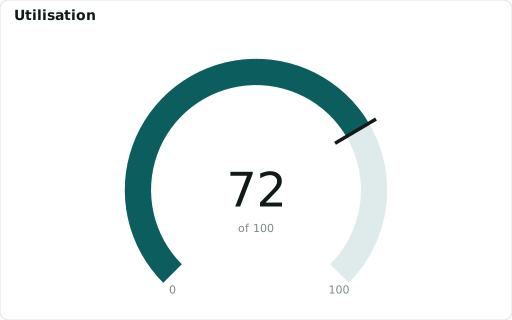
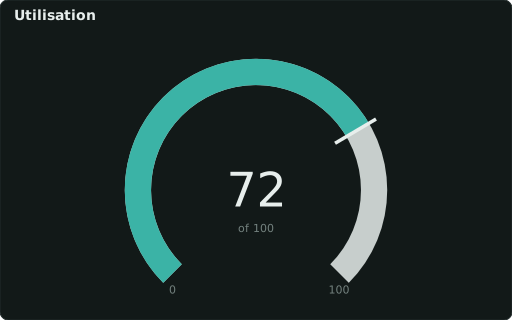
Value as an arc toward ::RANGE ‘min,max’ (zones: ::COLORS, ::LABELS).
Also spelled: ::GAUGE_PERCENT
The data it needs
Section titled “The data it needs”One row, one value; ::RANGE 'min,max' sets the arc (default 0–100).
SELECT 72 ::GAUGE, '0,100' ::RANGE, 'Utilisation' ::TITLE;In an example
Section titled “In an example”From Can we build a dashboard without a data source? — open it in the builder ↗:
SELECT round(100.0*count(*) FILTER (WHERE sin(i/6.0) > 0)/count(*),0)::GAUGE, '0,100'::RANGE, '#e03131,#efc94c,#0ca678'::COLORS, 'Time above mean'::TITLEFROM range(0,120) t(i)Also in: Which chart fits which question? · How do we plan a busy day at the distribution centre? · Can we switch on the new CRM?
Related
Section titled “Related”::PIE · ::DONUTCHART · ::RADAR · ::SANKEY · ::TREEMAP